Kaggle | 全球听众最多的50首歌曲
@Author:By Runsen
Spotify是全球听众最多的50首歌曲
数据集摘要:Spotify在2019年收听的前50首歌曲
链接:https://www.kaggle.com/leonardopena/top50spotify2019
Spotify: (Spotify:声田 是一个正版流媒体音乐服务平台,2008年10月在瑞典首都斯德哥尔摩正式上线。Spotify提供免费和付费两种服务,免费用户在使用Spotify的服务时将被插播一定的广告,付费用户则没有广告,且拥有更好的音质。
2017年12月8日,Spotify与腾讯公司及腾讯旗下的腾讯音乐娱乐集团联合宣布股权投资,加强这两家全球最受欢迎的数字音乐平台的关系。 2018年4月3日,Spotify登录纽交所,成为首家“直接上市”的公司 [。2018年8月8日,华纳音乐集团宣布,集团已经出售了此前所持流媒体音乐服务提供商Spotify的全部股份。 2018年12月,世界品牌实验室发布《2018世界品牌500强》榜单,Spotify排名第378。 2019年10月,Interbrand发布的全球品牌百强榜排名92 。
| 名称 | Graduate Admission |
|---|---|
| 特征简介 | **Track.name:**曲目的名称 **艺术家姓名:**艺术家姓名 曲目类型 每分钟的节奏 **能量:**一首歌的能量-值越高,能量越大。歌曲 **舞蹈性:**舞蹈性越高,就越容易跟着这首歌跳舞。 **响度:**dB值越高,歌曲越响。 **活性:**活性值越高,歌曲越有可能是现场录制的。 **价格:**价值越高,歌曲的积极情绪就越强。 **长度:**歌曲的持续时间。 **音质:**值越高,歌曲的音质越好。 **言语:**价值越高,歌曲包含的口语词越多。 **流行:**歌曲价值越高越受欢迎。 |
| 记录数 | 50 |
| 分析目标 | 分析Spotify在2019年收听的前50首歌曲 |
| 分析思路及方法 | 最有活力的歌是什么? 哪首歌最具舞蹈性? 哪首歌更响亮? 哪首歌最活泼? 哪首歌最长? 哪首歌最流行? |
该数据集包括23486行和10个特征变量。每行对应一个客户评论,并包含以下变量:
Track.name:曲目的名称
艺术家姓名:艺术家姓名
曲目类型
每分钟的节奏
能量:一首歌的能量-值越高,能量越大。歌曲
舞蹈性:舞蹈性越高,就越容易跟着这首歌跳舞。
响度:dB值越高,歌曲越响。
活性:活性值越高,歌曲越有可能是现场录制的。
价格:价值越高,歌曲的积极情绪就越强。
长度:歌曲的持续时间。
音质:值越高,歌曲的音质越好。
言语:价值越高,歌曲包含的口语词越多。
流行:歌曲价值越高越受欢迎。
| 中文名称 | 英文名称 |
|---|---|
| 曲目的名称 | Track.name |
| 艺术家姓名 | Artist.Name |
| 曲目类型 | Genre |
| 每分钟的节奏 | Beats.Per.Minute |
| 能量 | Energy |
| 舞蹈性 | Danceability |
| 响度 | Loudness…dB… |
| 活性值 | Liveness |
| 价格 | Valence. |
| 长度 | Length. |
| 音质 | Acousticness… |
| 口语词 | Speechiness. |
| 流行 | Popularity |
pandas:pandas是基于NumPy的一种工具,该工具是为了解决数据分析任务而创建的。Pandas纳入了大量库和一些标准的数据模型,提供了高效地操作大型数据集所需的工具。pandas提供了大量能使我们快速便捷地处理数据的函数和方法。
Matplotlib:Matplotlib就是Python绘图库中的佼佼者,它包含了大量的工具,你可以使用这些工具创建各种图形(包括散点图、折线图、直方图、饼图、雷达图等),Python科学计算社区也经常使用它来完成数据可视化的工作。
Seaborn:Seaborn是基于matplotlib的图形可视化python包。它提供了一种高度交互式界面,便于用户能够做出各种有吸引力的统计图表。
pandas库支持csv和excel的操作;使用的是pd.read_csv的函数
导入numpy,seaborn``matplotlib和pandas读取Womens Clothing E-Commerce Reviews.csv
参数:index_col=0——第一列为index值
import pandas as pd
import matplotlib.pyplot as plt
import numpy as np
import seaborn as sns
df= pd.read_csv('top50.csv', encoding='cp1252')
df.rename(columns={'Track.Name':'track_name','Artist.Name':'artist_name','Beats.Per.Minute':'beats_per_minute','Loudness..dB..':'Loudness(dB)','Valence.':'Valence','Length.':'Length', 'Acousticness..':'Acousticness','Speechiness.':'Speechiness'},inplace=True)
查看df.head


从df.info可以看出并没有缺失数据,50个数据都具有完整性
df.describe().T

数据中的Length,Per.Minute,Valence的std标准差都比较大,说明数据分布不均匀
三、 数据分析 1、最有活力的歌是什么?只需要简单通过np.max()方法来去除Energy最大的歌曲
df[df.Energy == np.max(df.Energy)]

我们可以从图片看出:最有活力的歌是Never Really Over,作者是凯蒂·佩里(Katy Perry),美国流行女歌手、
2、哪首歌最具舞蹈性?df[df.Danceability == np.max(df.Danceability)]

我们可以从图片看出:最具舞蹈性是Talk,作者是Khalid
3、哪首歌更响亮?df[df['Loudness(dB)'] == np.max(df['Loudness(dB)'])]

我们可以从图片看出:最具响亮,dB值最高的是Otro Trago - Remix和One Thing Right
df[df['Liveness'] == np.max(df['Liveness'])]

我们可以从图片看出:最活泼是One Thing Right
df[df['Length'] == np.max(df['Length'])]

我们可以从图片看出:最长是No Me Conoce - Remix
df[df['Popularity'] == np.max(df['Popularity'])]

我们可以从图片看出:最流行的是bad guy
from matplotlib import pyplot as plt
from wordcloud import WordCloud, STOPWORDS
string=str(df.artist_name)
wordcloud = WordCloud(stopwords=STOPWORDS,
                      background_color='white',
                      width=1000,
                      height=1000).generate(string)
plt.figure(figsize=(10,8))
plt.imshow(wordcloud,interpolation='bilinear')
plt.axis("off")
plt.show()

from matplotlib import pyplot as plt
from wordcloud import WordCloud, STOPWORDS
string=str(df.Genre)
wordcloud = WordCloud(stopwords=STOPWORDS,
                      background_color='white',
                      width=1000,
                      height=1000).generate(string)
plt.figure(figsize=(10,8))
plt.imshow(wordcloud,interpolation='bilinear')
plt.axis("off")
plt.show()
[外链图片转存失败,源站可能有防盗链机制,建议将图片保存下来直接上传(img-gpXW14lr-1582528988980)(./image/12.png)]
pop,dance流行歌曲占了很大的比重
from matplotlib import pyplot as plt
from wordcloud import WordCloud, STOPWORDS
string=str(df.track_name)
wordcloud = WordCloud(stopwords=STOPWORDS,
                      background_color='white',
                      width=1000,
                      height=1000).generate(string)
plt.figure(figsize=(10,8))
plt.imshow(wordcloud,interpolation='bilinear')
plt.axis("off")
plt.show()
[外链图片转存失败,源站可能有防盗链机制,建议将图片保存下来直接上传(img-Rg1ldyTB-1582528988981)(./image/13.png)]

import matplotlib
from matplotlib import pyplot as plt
matplotlib.style.use('ggplot')
df.plot(figsize=(20,10))

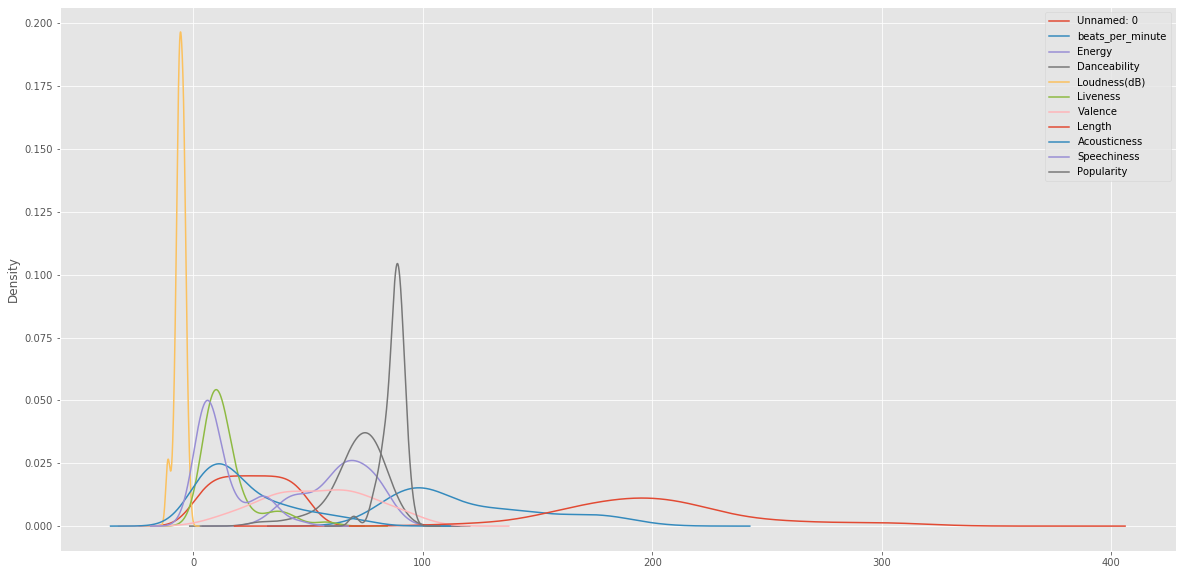
df.plot(kind='density',figsize=(20,10))

plt.figure(figsize=(20,10))
sns.countplot(df['Genre'])
plt.show()

singers = df["artist_name"].value_counts()
plt.figure(figsize=(20,10))
singers.plot.bar()
plt.xlabel("Singers")
plt.ylabel("# of Songs")
plt.title("The # of songs each singer has")
plt.show()

singer_popularity = (
    df.groupby("artist_name")["Popularity"].sum().sort_values(ascending=False)
)
plt.figure(figsize=(20,10))
singer_popularity.plot.bar()
plt.xlabel("Singers")
plt.ylabel("Total popularity")
plt.title("Total popularity each singer has")
plt.show()

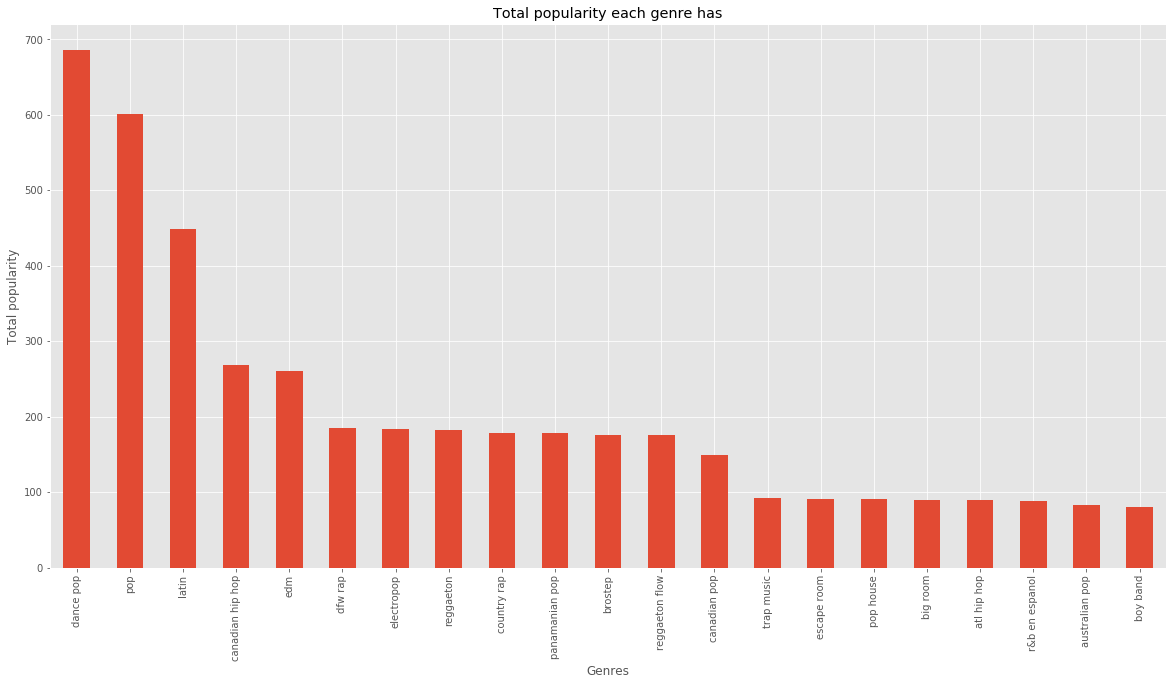
genre_popularity = (
    df.groupby("Genre")["Popularity"].sum().sort_values(ascending=False)
)
plt.figure(figsize=(20,10))
genre_popularity.plot.bar()
plt.xlabel("Genres")
plt.ylabel("Total popularity")
plt.title("Total popularity each genre has")
plt.show()

plt.figure(figsize=(20,10))
plt.scatter("Danceability", "Popularity", data=df.sort_values(by=["Danceability"]))
plt.title("The relationship between danceability and popularity")
plt.xlabel("Danceability")
plt.ylabel("Popularity")
plt.show()

plt.figure(figsize=(20,10))
plt.scatter(
    "Loudness(dB)", "Popularity", data=df.sort_values(by=["Loudness(dB)"])
)
plt.title("The relationship between dB and popularity")
plt.xlabel("Loudness(dB)")
plt.ylabel("Popularity")
plt.show()

plt.figure(figsize=(20,10))
plt.scatter("Liveness", "Popularity", data=df.sort_values(by=["Liveness"]))
plt.title("The relationship between liveness and popularity")
plt.xlabel("Liveness")
plt.ylabel("Popularity")
plt.show()

该模型属于预测模型,**流行: **Popularity作为y的label
其他数据作为x变量,预测出歌曲是否流行,流行度如何
删除无用Unnamed: 0数据
df.drop(columns=['Unnamed: 0'],inplace=True)
将Genre进行One-HOT编码,因为Genre是字符串,无法进行处理
from sklearn.preprocessing import LabelEncoder
label = LabelEncoder()
df.Genre = label.fit_transform(df.Genre)
2、建立X,Y
X = df[['Genre', 'beats_per_minute', 'Energy', 'Danceability',
       'Loudness(dB)', 'Liveness', 'Valence', 'Length', 'Acousticness',
       'Speechiness']]
y = df.Popularity
3、划分数据集和缩放数据
from sklearn.model_selection import train_test_split
X_train, X_test, y_train, y_test = train_test_split(X,y,test_size=0.3,random_state=42)
from sklearn.preprocessing import StandardScaler
scaler = StandardScaler()
X_train = scaler.fit_transform(X_train)
X_test = scaler.transform(X_test)
4、线性模型
线性模型是一类统计模型的总称,制作方法是用一定的流程将各个环节连接起来
导入sklearn.linear_model中的LinearRegression
模型评估:在常用的回归评估指标包括:
r2_score explained_variance_score这里使用的是r2_score
R2 决定系数(拟合优度)
模型越好:r2

→1
模型越差:r2→0
from sklearn.linear_model import LinearRegression
# Creating the object
regressor = LinearRegression()
# Fit the model.
regressor.fit(X_train, y_train)
LinearRegression(copy_X=True, fit_intercept=True, n_jobs=None, normalize=False)
# Predicting the test results.
y_pred = regressor.predict(X_test)
# Checking the predictions.
y_pred

from sklearn.metrics import r2_score
print("r_square score: ", r2_score(y_test,y_pred))

公众号

作者:润森笔记