二手车交易价格预测day1
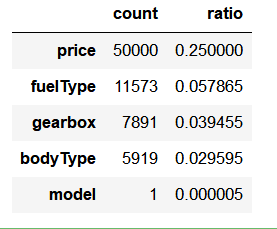
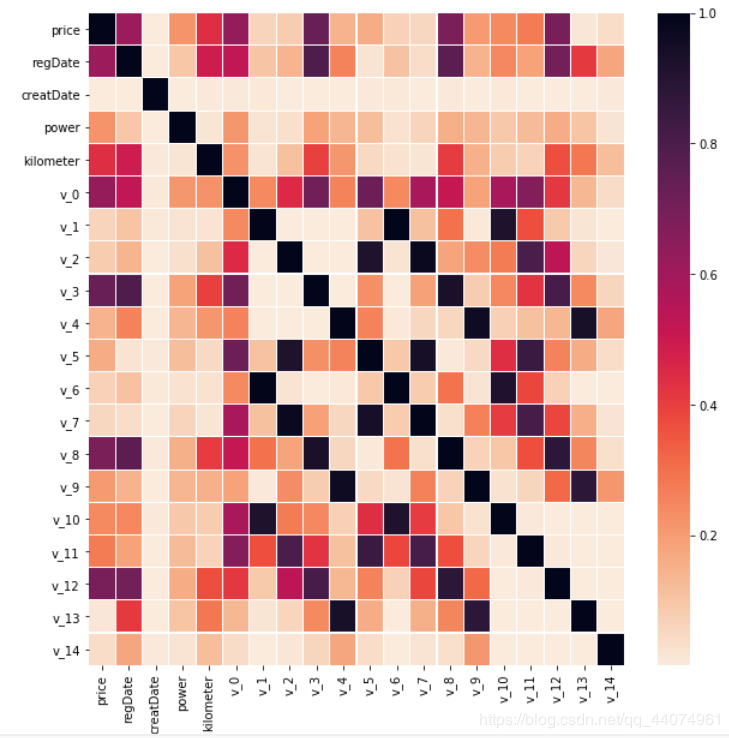
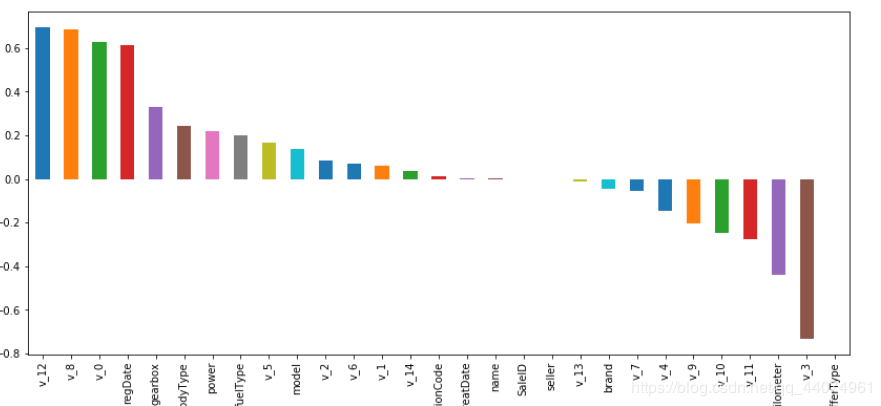
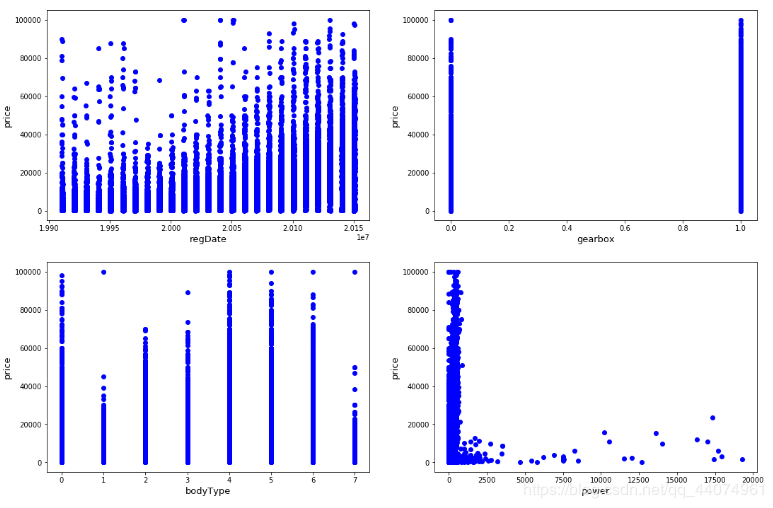
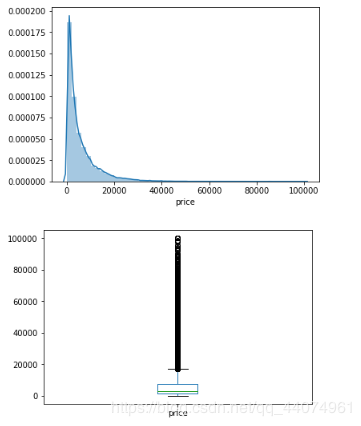
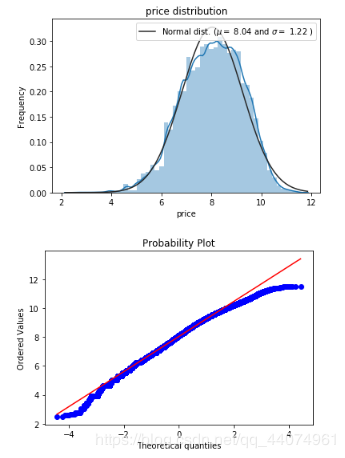
二手车交易价格预测day11.加载所需的库数据2. 读取数据集2.数据的探索性可视化分析数据里面有的值大,有的值小,有的列还有缺失值等等,如何快速查看这些数据的分布呢?如何更加明了的以图像的方式呈现呢?在这里,你可以使用pandas_profiling模块工具一键生成探索性数据分析报告为了后续可以同时对训练数据集和测试数据集进一步进行数据清洗和特征工程,这里先将训练集和测试集数据进行合并查看训练集的列名查看各属性列的数据缺失比例把特征分成三部分,分别是日期特征、类别特征、数值特征查看各个数值特征跟price的相关性。查看各个数值特征跟price的正负相关性(直方图)上面的数据探索发现,从业务角度理解,regDate、gearbox、bodyType、 power四个变量对房价有重要意义,那么根据这四个变量和目标值之间的关系绘制散点图检查异常值点:观察训练集标签的分布情况(画图)这里我们需要将它变换成无偏的正态分布,因为通常的线性模型所针对的数据都是正态分布的数据
1.加载所需的库数据
作者:爱冒险的梦(Lqh)
import numpy as np
import pandas as pd
from scipy.stats import norm
from scipy import stats
import warnings
import matplotlib
import matplotlib.pyplot as plt
import seaborn as sns
from tqdm import tqdm
2. 读取数据集
train_data = pd.read_csv(r'C:\Users\Administrator\Desktop\lingjichurumen\used_car_train_20200313.csv', sep=' ')
test_data = pd.read_csv(r'C:\Users\Administrator\Desktop\lingjichurumen\used_car_testA_20200313.csv', sep=' ')
2.数据的探索性可视化分析
数据里面有的值大,有的值小,有的列还有缺失值等等,如何快速查看这些数据的分布呢?如何更加明了的以图像的方式呈现呢?在这里,你可以使用pandas_profiling模块工具一键生成探索性数据分析报告
ppf.ProfileReport(df_train) # 一键进行探索性可视化分析
为了后续可以同时对训练数据集和测试数据集进一步进行数据清洗和特征工程,这里先将训练集和测试集数据进行合并
train_data = pd.read_csv(r'C:\Users\Administrator\Desktop\lingjichurumen\used_car_train_20200313.csv', sep=' ')
test_data = pd.read_csv(r'C:\Users\Administrator\Desktop\lingjichurumen\used_car_testA_20200313.csv', sep=' ')
查看训练集的列名
Train_data.columns
Index([‘SaleID’, ‘name’, ‘regDate’, ‘model’, ‘brand’, ‘bodyType’, ‘fuelType’,
‘gearbox’, ‘power’, ‘kilometer’, ‘notRepairedDamage’, ‘regionCode’,
‘seller’, ‘offerType’, ‘creatDate’, ‘price’, ‘v_0’, ‘v_1’, ‘v_2’, ‘v_3’,
‘v_4’, ‘v_5’, ‘v_6’, ‘v_7’, ‘v_8’, ‘v_9’, ‘v_10’, ‘v_11’, ‘v_12’,
‘v_13’, ‘v_14’],
dtype=‘object’)
测试集与训练集只差一个price列名。
count=all_data.isnull().sum().sort_values(ascending=False)
ratio=count/len(all_data)
nulldata=pd.concat([count,ratio],axis=1,keys=['count','ratio'])
nulldata[nulldata.ratio>0]
# del count, ratio
date_cols = ['regDate', 'creatDate']
cate_cols = ['name', 'model', 'brand', 'bodyType', 'fuelType', 'gearbox', 'notRepairedDamage', 'regionCode', 'seller', 'offerType']
num_cols = ['power', 'kilometer'] + ['v_{}'.format(i) for i in range(15)]
cols = date_cols + cate_cols + num_cols
查看各个数值特征跟price的相关性。
corr1 = abs(train_data[~train_data['price'].isnull()][['price'] + date_cols + num_cols].corr())
plt.figure(figsize=(10, 10))
sns.heatmap(corr1, linewidths=0.1, cmap=sns.cm.rocket_r)
corr_with_sale_price = train_data.corr()["price"].sort_values(ascending=False)
plt.figure(figsize=(14,6))
corr_with_sale_price.drop("price").plot.bar()
plt.show();
plt.figure(figsize=(18,12))
plt.subplot(2, 2, 1)
plt.scatter(x=train_data.regDate, y=train_data.price,color='b') ##可以用来观察存在线型的关系
plt.xlabel("regDate", fontsize=13)
plt.ylabel("price", fontsize=13)
plt.subplot(2, 2, 2)
plt.scatter(x=train_data.gearbox, y=train_data.price,color='b') ##可以用来观察存在线型的关系
plt.xlabel("gearbox", fontsize=13)
plt.ylabel("price", fontsize=13)
plt.subplot(2, 2, 3)
plt.scatter(x=train_data.bodyType, y=train_data.price,color='b') ##可以用来观察存在线型的关系
plt.xlabel("bodyType", fontsize=13)
plt.ylabel("price", fontsize=13)
plt.subplot(2, 2, 4)
plt.scatter(x=train_data.power, y=train_data.price,color='b') ##可以用来观察存在线型的关系
plt.xlabel("power", fontsize=13)
plt.ylabel("price", fontsize=13)
plt.show()
plt.figure()
sns.distplot(train_df['price'])
plt.figure()
train_df['price'].plot.box()
plt.show()
##  此函数用于绘制特征变量的分布图像
def plt_distribution(data, obj_col):
    sns.distplot(data[obj_col] , fit=norm);
    # 获取训练集数据分布曲线的拟合均值和标准差
    (mu, sigma) = norm.fit(data[obj_col])
    print( '\n mu = {:.2f} and sigma = {:.2f}\n'.format(mu, sigma))
    # 绘制分布曲线
    plt.legend(['Normal dist. ($\mu=$ {:.2f} and $\sigma=$ {:.2f} )'.format(mu, sigma)],
                loc='best')
    plt.ylabel('Frequency')
    plt.title('price distribution')
    # 绘制图像查看数据的分布状态
    fig = plt.figure()
    res = stats.probplot(data[obj_col], plot=plt)
    plt.show()
待续…(ps:第一次写博客,编辑的我头疼,写这一点谢啦我一个小时…)
作者:爱冒险的梦(Lqh)