shuxuemoxing_iris visilization
玩转鸾尾花
Iris 鸢尾花数据集是一个经典数据集,在统计学习和机器学习领域都经常被用作示例。
\quad数据集内包含 3 类共 150 条记录,每类各 50 个数据,
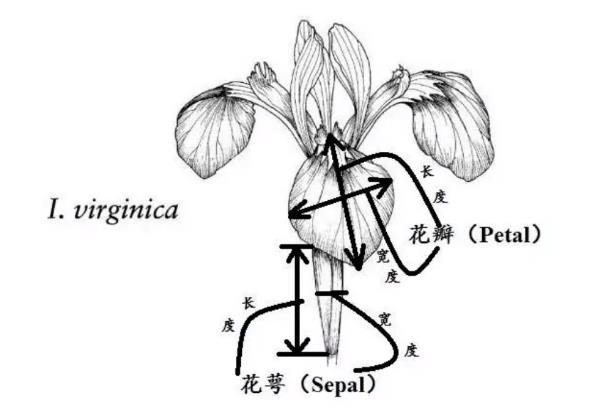
\quad每条记录都有 4 项特征:花萼长度、花萼宽度、花瓣长度、花瓣宽度,
可以通过这4个特征预测鸢尾花卉属于(iris-setosa, iris-versicolour, iris-virginica)中的哪一品种。
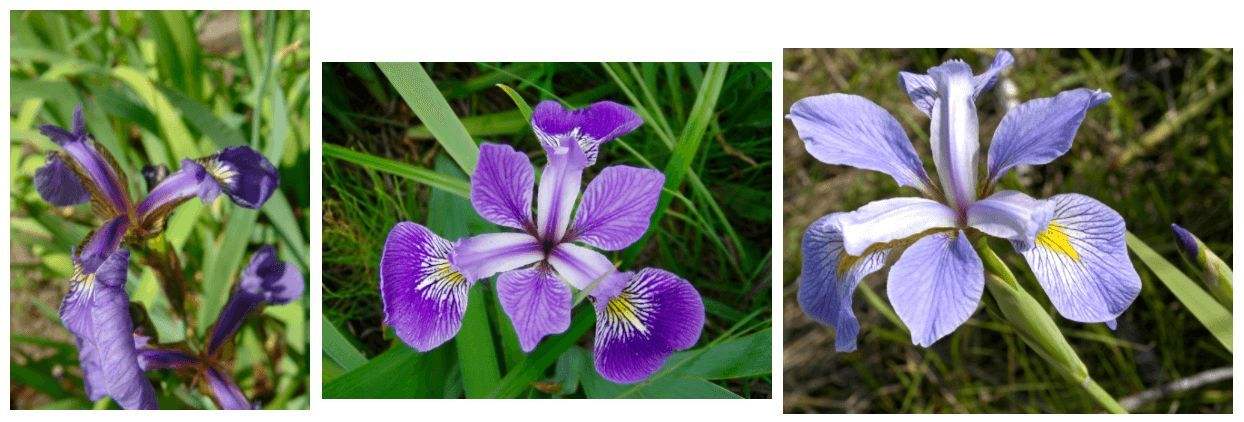
\quadsetosa是山鸾尾,versicolour是变色鸾尾(或彩色鸾尾),virginica是维吉尼亚鸾尾。
\quad下面3幅图分别是setosa,versicolour,virginica。
from sklearn import datasets
iris = datasets.load_iris()
dir(iris)
['DESCR', 'data', 'feature_names', 'filename', 'target', 'target_names']
iris.feature_names
['sepal length (cm)',
 'sepal width (cm)',
 'petal length (cm)',
 'petal width (cm)']
iris.data # train set训练集
array([[5.1, 3.5, 1.4, 0.2],
       [4.9, 3. , 1.4, 0.2],
       [4.7, 3.2, 1.3, 0.2],
       [4.6, 3.1, 1.5, 0.2],
       [5. , 3.6, 1.4, 0.2],
       [5.4, 3.9, 1.7, 0.4],
       [4.6, 3.4, 1.4, 0.3],
       [5. , 3.4, 1.5, 0.2],
       [4.4, 2.9, 1.4, 0.2],
       [4.9, 3.1, 1.5, 0.1],
       [5.4, 3.7, 1.5, 0.2],
       [4.8, 3.4, 1.6, 0.2],
       [4.8, 3. , 1.4, 0.1],
        ......
       [5.9, 3. , 5.1, 1.8]])
iris.target
array([0, 0, 0, 0, 0, 0, 0, 0, 0, 0, 0, 0, 0, 0, 0, 0, 0, 0, 0, 0, 0, 0,
       0, 0, 0, 0, 0, 0, 0, 0, 0, 0, 0, 0, 0, 0, 0, 0, 0, 0, 0, 0, 0, 0,
       0, 0, 0, 0, 0, 0, 1, 1, 1, 1, 1, 1, 1, 1, 1, 1, 1, 1, 1, 1, 1, 1,
       1, 1, 1, 1, 1, 1, 1, 1, 1, 1, 1, 1, 1, 1, 1, 1, 1, 1, 1, 1, 1, 1,
       1, 1, 1, 1, 1, 1, 1, 1, 1, 1, 1, 1, 2, 2, 2, 2, 2, 2, 2, 2, 2, 2,
       2, 2, 2, 2, 2, 2, 2, 2, 2, 2, 2, 2, 2, 2, 2, 2, 2, 2, 2, 2, 2, 2,
       2, 2, 2, 2, 2, 2, 2, 2, 2, 2, 2, 2, 2, 2, 2, 2, 2, 2])
iris_data_and_target=np.hstack((iris.data,iris.target.reshape(-1,1).astype(np.int32)))
iris1['Species'] = load_iris().target
array([[5.1, 3.5, 1.4, 0.2, 0. ],
       [4.9, 3. , 1.4, 0.2, 0. ],
       [4.7, 3.2, 1.3, 0.2, 0. ],
       [4.6, 3.1, 1.5, 0.2, 0. ],
       [5. , 3.6, 1.4, 0.2, 0. ],
       [5.4, 3.9, 1.7, 0.4, 0. ],
       [4.6, 3.4, 1.4, 0.3, 0. ],
       [5. , 3.4, 1.5, 0.2, 0. ],
       [4.4, 2.9, 1.4, 0.2, 0. ],
       [4.9, 3.1, 1.5, 0.1, 0. ],
       [5.4, 3.7, 1.5, 0.2, 0. ],
       [4.8, 3.4, 1.6, 0.2, 0. ],
       [4.8, 3. , 1.4, 0.1, 0. ],
       [4.3, 3. , 1.1, 0.1, 0. ],
       [5.8, 4. , 1.2, 0.2, 0. ],
       [5.7, 4.4, 1.5, 0.4, 0. ],
       [5.4, 3.9, 1.3, 0.4, 0. ],
       [5.1, 3.5, 1.4, 0.3, 0. ],
       [5.7, 3.8, 1.7, 0.3, 0. ],
       [5.1, 3.8, 1.5, 0.3, 0. ],
        ......
       [5.9, 3. , 5.1, 1.8, 2. ]])
iris.feature_names
['sepal length (cm)',
 'sepal width (cm)',
 'petal length (cm)',
 'petal width (cm)']
iris.target_names
array(['setosa', 'versicolor', 'virginica'], dtype='<U10')
print(iris.DESCR)
.. _iris_dataset:
Iris plants dataset
--------------------
**Data Set Characteristics:**
    :Number of Instances: 150 (50 in each of three classes)
    :Number of Attributes: 4 numeric, predictive attributes and the class
    :Attribute Information:
        - sepal length in cm
        - sepal width in cm
        - petal length in cm
        - petal width in cm
        - class:
                - Iris-Setosa
                - Iris-Versicolour
                - Iris-Virginica
    :Summary Statistics:
    ============== ==== ==== ======= ===== ====================
                    Min  Max   Mean    SD   Class Correlation
    ============== ==== ==== ======= ===== ====================
    sepal length:   4.3  7.9   5.84   0.83    0.7826
    sepal width:    2.0  4.4   3.05   0.43   -0.4194
    petal length:   1.0  6.9   3.76   1.76    0.9490  (high!)
    petal width:    0.1  2.5   1.20   0.76    0.9565  (high!)
    ============== ==== ==== ======= ===== ====================
    :Missing Attribute Values: None
    :Class Distribution: 33.3% for each of 3 classes.
    :Creator: R.A. Fisher
    :Donor: Michael Marshall (MARSHALL%PLU@io.arc.nasa.gov)
    :Date: July, 1988
The famous Iris database, first used by Sir R.A. Fisher. The dataset is taken
from Fisher's paper. Note that it's the same as in R, but not as in the UCI
Machine Learning Repository, which has two wrong data points.
This is perhaps the best known database to be found in the
pattern recognition literature.  Fisher's paper is a classic in the field and
is referenced frequently to this day.  (See Duda & Hart, for example.)  The
data set contains 3 classes of 50 instances each, where each class refers to a
type of iris plant.  One class is linearly separable from the other 2; the
latter are NOT linearly separable from each other.
.. topic:: References
   - Fisher, R.A. "The use of multiple measurements in taxonomic problems"
     Annual Eugenics, 7, Part II, 179-188 (1936); also in "Contributions to
     Mathematical Statistics" (John Wiley, NY, 1950).
   - Duda, R.O., & Hart, P.E. (1973) Pattern Classification and Scene Analysis.
     (Q327.D83) John Wiley & Sons.  ISBN 0-471-22361-1.  See page 218.
   - Dasarathy, B.V. (1980) "Nosing Around the Neighborhood: A New System
     Structure and Classification Rule for Recognition in Partially Exposed
     Environments".  IEEE Transactions on Pattern Analysis and Machine
     Intelligence, Vol. PAMI-2, No. 1, 67-71.
   - Gates, G.W. (1972) "The Reduced Nearest Neighbor Rule".  IEEE Transactions
     on Information Theory, May 1972, 431-433.
   - See also: 1988 MLC Proceedings, 54-64.  Cheeseman et al"s AUTOCLASS II
     conceptual clustering system finds 3 classes in the data.
   - Many, many more ...
import pandas as pd
iris_df = pd.DataFrame(iris.data, columns=['SepalLengthCm','SepalWidthCm','PetalLengthCm','PetalWidthCm'])
iris_df['Species'] = load_iris().target
iris_df.head(10)
| SepalLengthCm | SepalWidthCm | PetalLengthCm | PetalWidthCm | Species | |
|---|---|---|---|---|---|
| 0 | 5.1 | 3.5 | 1.4 | 0.2 | 0 |
| 1 | 4.9 | 3.0 | 1.4 | 0.2 | 0 |
| 2 | 4.7 | 3.2 | 1.3 | 0.2 | 0 |
| 3 | 4.6 | 3.1 | 1.5 | 0.2 | 0 |
| 4 | 5.0 | 3.6 | 1.4 | 0.2 | 0 |
| 5 | 5.4 | 3.9 | 1.7 | 0.4 | 0 |
| 6 | 4.6 | 3.4 | 1.4 | 0.3 | 0 |
| 7 | 5.0 | 3.4 | 1.5 | 0.2 | 0 |
| 8 | 4.4 | 2.9 | 1.4 | 0.2 | 0 |
| 9 | 4.9 | 3.1 | 1.5 | 0.1 | 0 |
import matplotlib.pyplot as plt
plt.rcParams['font.sans-serif']=['SimHei'] #用来正常显示中文标签
plt.rcParams['axes.unicode_minus']=False #用来正常显示负号
plt.figure(figsize=(12,7))
x=iris.data
y=iris.target
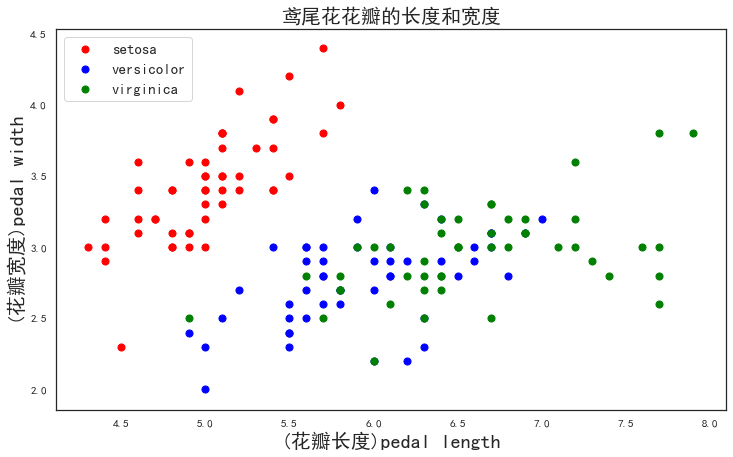
p1=plt.scatter(x[y==0,0],x[y==0,1],color='red',s=50)#取特征第0,1列,绘制类别为0的,颜色red
p2=plt.scatter(x[y==1,0],x[y==1,1],color='blue',s=50)#取特征第0,1列,绘制类别为1的,颜色blue
p3=plt.scatter(x[y==2,0],x[y==2,1],color='green',s=50)#取特征第0,1列,绘制类别为2的,颜色green
plt.legend([p1,p2,p3],['setosa','versicolor','virginica'],loc='upper left',fontsize=15)
plt.title('鸢尾花花瓣的长度和宽度',fontsize=20)
plt.xlabel('(花瓣长度)pedal length',fontsize=20)
plt.ylabel('(花瓣宽度)pedal width',fontsize=20)
plt.show()
# x=iris.data
# y=iris.target
import matplotlib.pyplot as plt
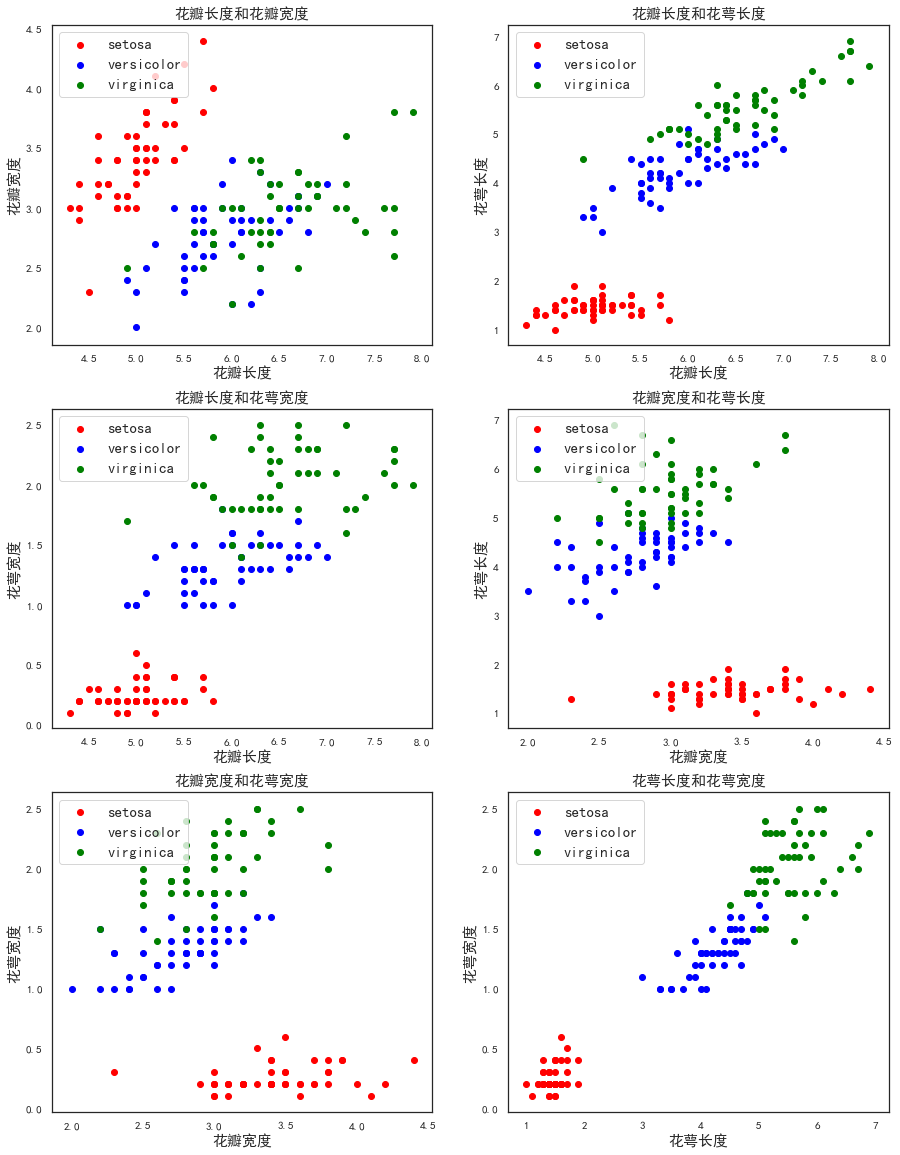
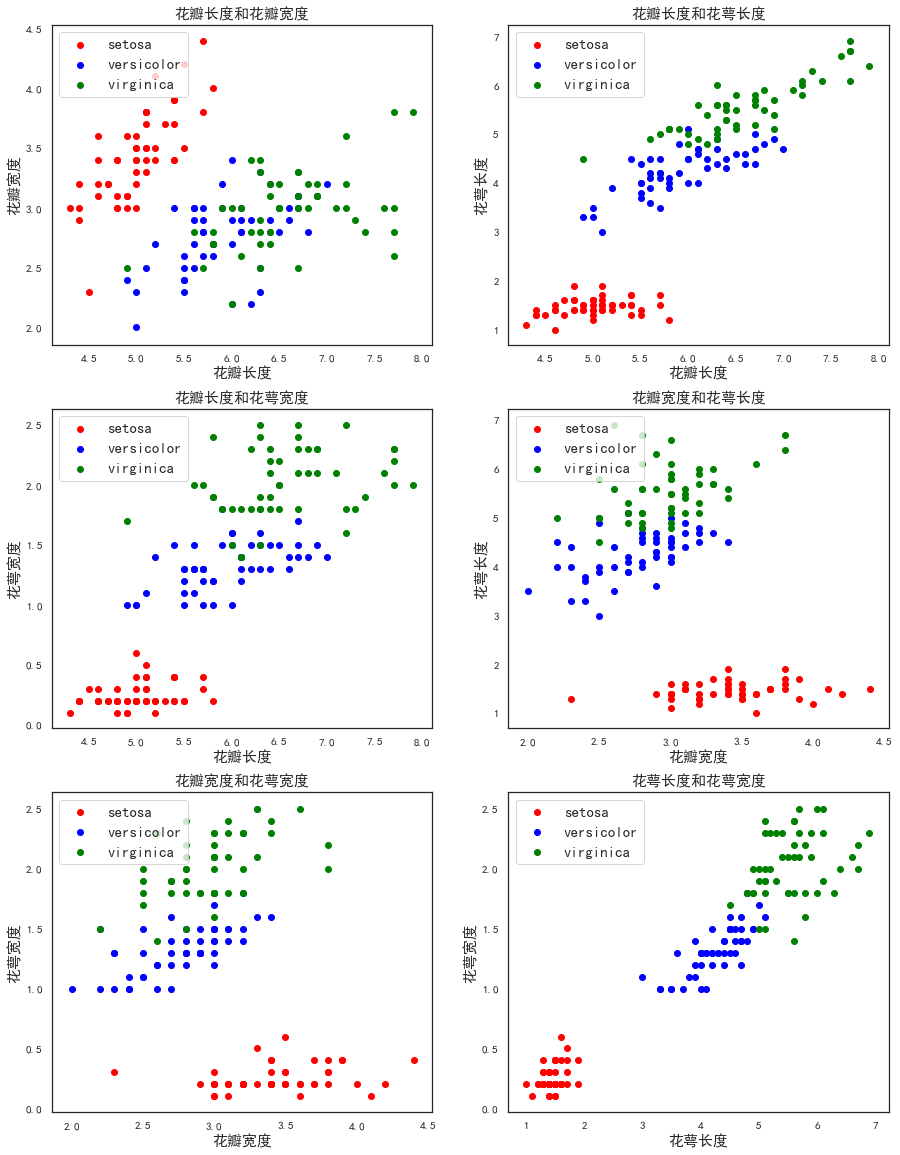
idx=np.array([[0,1],[0,2],[0,3],[1,2],[1,3],[2,3]])
fig=plt.figure(figsize=(15,20))
x=iris.data
y=iris.target
for i in range(1,7):
    ax=fig.add_subplot(3,2,i)
    p1=ax.scatter(x[y==0,idx[i-1,0]],x[y==0,idx[i-1,1]],color='red')#取特征第0,1列,绘制类别为0的,颜色red
    p2=ax.scatter(x[y==1,idx[i-1,0]],x[y==1,idx[i-1,1]],color='blue')#取特征第0,1列,绘制类别为1的,颜色blue
    p3=ax.scatter(x[y==2,idx[i-1,0]],x[y==2,idx[i-1,1]],color='green')#取特征第0,1列,绘制类别为2的,颜色green
    plt.legend([p1,p2,p3],['setosa','versicolor','virginica'],loc='upper left',fontsize=15)
    titles=np.array(['花瓣长度和花瓣宽度','花瓣长度和花萼长度','花瓣长度和花萼宽度',
                    '花瓣宽度和花萼长度','花瓣宽度和花萼宽度','花萼长度和花萼宽度'])
    ax.set_title(titles[i-1],fontsize=15)
    labels=np.array(['花瓣长度','花瓣宽度','花萼长度','花萼宽度'])
    ax.set_xlabel(labels[idx[i-1]][0],fontsize=15)
    ax.set_ylabel(labels[idx[i-1]][1],fontsize=15)
plt.show()
import numpy as np
import matplotlib.pyplot as plt
from matplotlib.colors import ListedColormap
from sklearn import datasets
from sklearn.neighbors import KNeighborsClassifier
iris = datasets.load_iris()
x = iris.data[:,[0,1]] #x - axis petals length -width
y = iris.target #y - axis species
x_min, x_max = x[:,0].min() - 0.5, x[:,0].max() + 0.5
y_min, y_max = x[:,1].min() - 0.5, x[:,1].max() + 0.5
# MESH
cmap_light = ListedColormap(['#AAAAFF','#AAFFAA','#FFAAAA'])
h = 0.2
xx, yy = np.meshgrid(np.arange(x_min, x_max, h), np.arange(y_min, y_max,h))
knn = KNeighborsClassifier()
knn.fit(x,y)
Z = knn.predict(np.c_[xx.ravel(),yy.ravel()])
Z = Z.reshape(xx.shape)
plt.figure(figsize=(10,6))
plt.pcolormesh(xx,yy,Z,cmap = cmap_light)
# Plot the training points
plt.scatter(x[:,0],x[:,1],c = y)
plt.xlim(xx.min(), xx.max())
plt.ylim(yy.min(), yy.max())
plt.show()
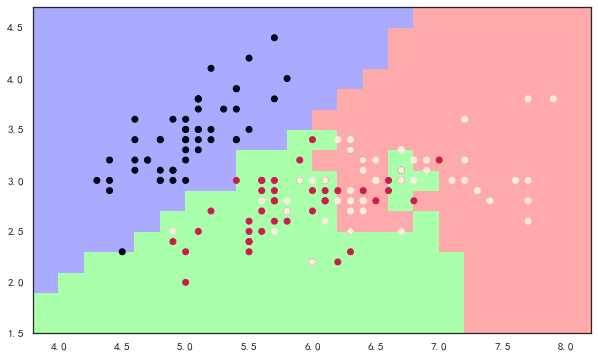
import matplotlib.pyplot as plt
from mpl_toolkits.mplot3d import Axes3D
fig=plt.figure(figsize=(17,17))
idx=np.array([[0,1,2],[0,1,3],[0,2,3],[1,2,3]])
x=iris.data
y=iris.target
for i in range(1,5):
    ax=fig.add_subplot(2,2,i,projection='3d')
    p1=ax.scatter3D(x[y==0,idx[i-1,0]],x[y==0,idx[i-1,1]],x[y==0,idx[i-1,2]],color='red',s=50)#取特征第0,1列,绘制类别为0的,颜色red
    p2=ax.scatter3D(x[y==1,idx[i-1,0]],x[y==1,idx[i-1,1]],x[y==1,idx[i-1,2]],color='blue',s=50)#取特征第0,1列,绘制类别为1的,颜色blue
    p3=ax.scatter3D(x[y==2,idx[i-1,0]],x[y==2,idx[i-1,1]],x[y==2,idx[i-1,2]],color='green',s=50)#取特征第0,1列,绘制类别为2的,颜色green
    ax.legend([p1,p2,p3],['setosa','versicolor','virginica'],loc='upper left',fontsize=10)
    titles=np.array(['花瓣长度,宽度,花萼长度','花瓣长度,宽度,花萼宽度','花瓣长度,花萼长度,宽度','花瓣宽度,花萼长度,宽度'])
    ax.set_title(titles[i-1],fontsize=12)
    labels=np.array(['花瓣长度','花瓣宽度','花萼长度','花萼宽度'])
    ax.set_xlabel('('+labels[idx[i-1]][0]+')pedal length',fontsize=12)
    ax.set_ylabel('('+labels[idx[i-1]][1]+')pedal width',fontsize=12)
    ax.set_zlabel('('+labels[idx[i-1]][2]+')sepal length',fontsize=12)
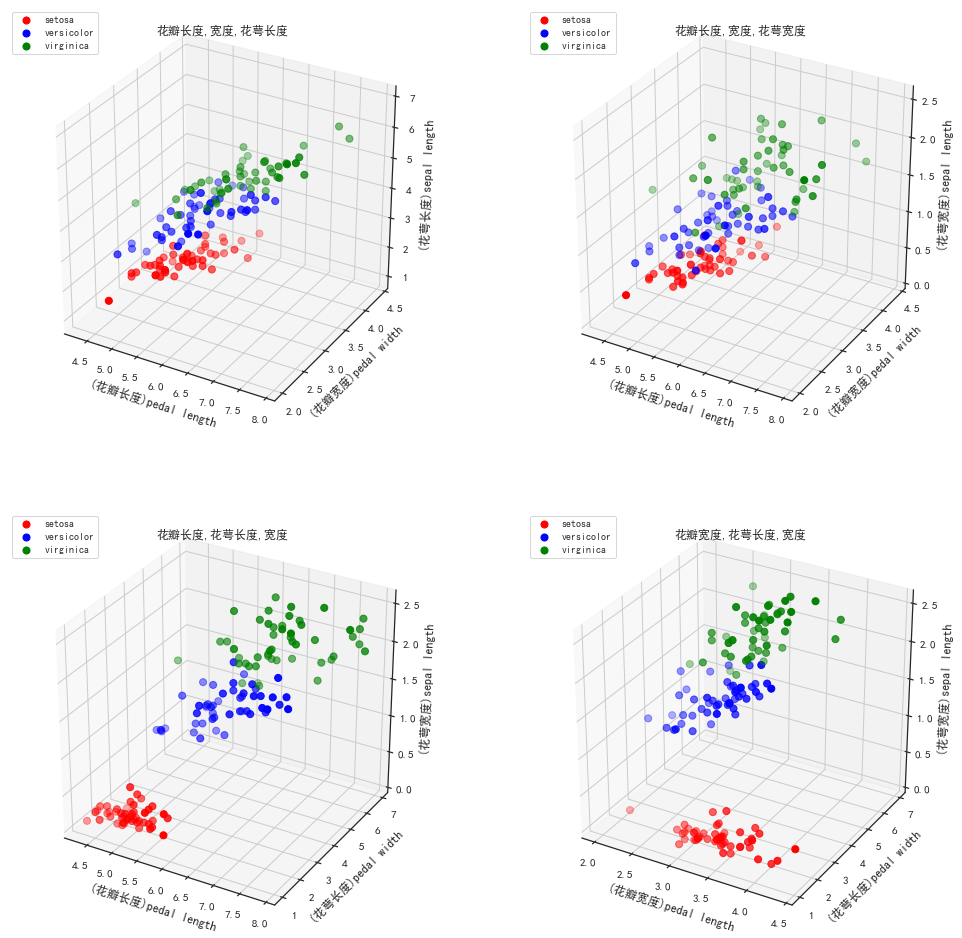
plt.show()
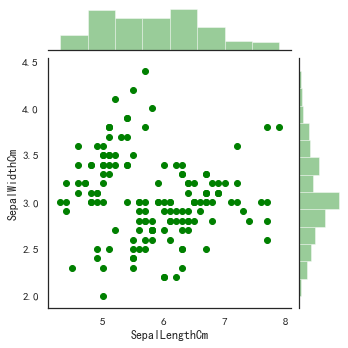
seaborn 的 jointplot 函数可以在同一个图中画出二变量的散点图和单变量的柱状图
import seaborn as sns
columns=['SepalLengthCm', 'SepalWidthCm', 'PetalLengthCm', 'PetalLengthCm','Species']
sns.jointplot(x="SepalLengthCm", y="SepalWidthCm", data=iris_df, size=5,color='green')
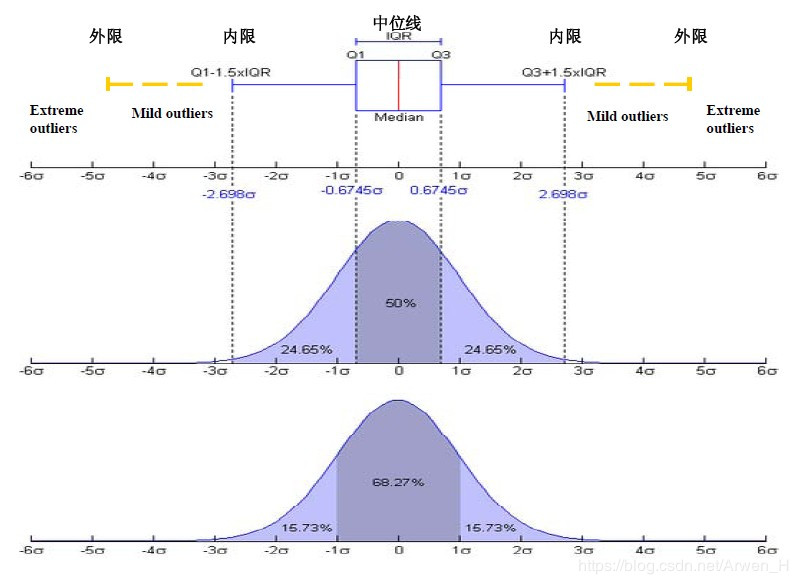
上限值:Q1-1.5×IQR
上相邻值:距离上限值最近的值
须线:上下分位数各自与上下相邻值的距离
上四分位数(Q1):一组数据按顺序排列,从小至大第25%位置的数值
中位数:一组数据按顺序排列,从小至大第50%位置的数值
中位线(IQR):Q3-Q1上四分位数至下四分位数的距离
下四分位数(Q3):一组数据按顺序排列,从小至大第75%位置的数值
下相邻值:距离下限值最近的值
下限值:Q3+1.5×IQR
离群值(异常值):一组数据中超过上下限的真实值
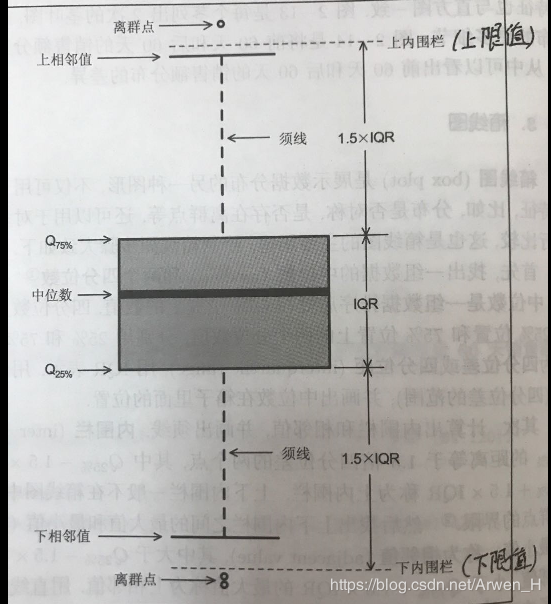
对照正态分布图来参考:
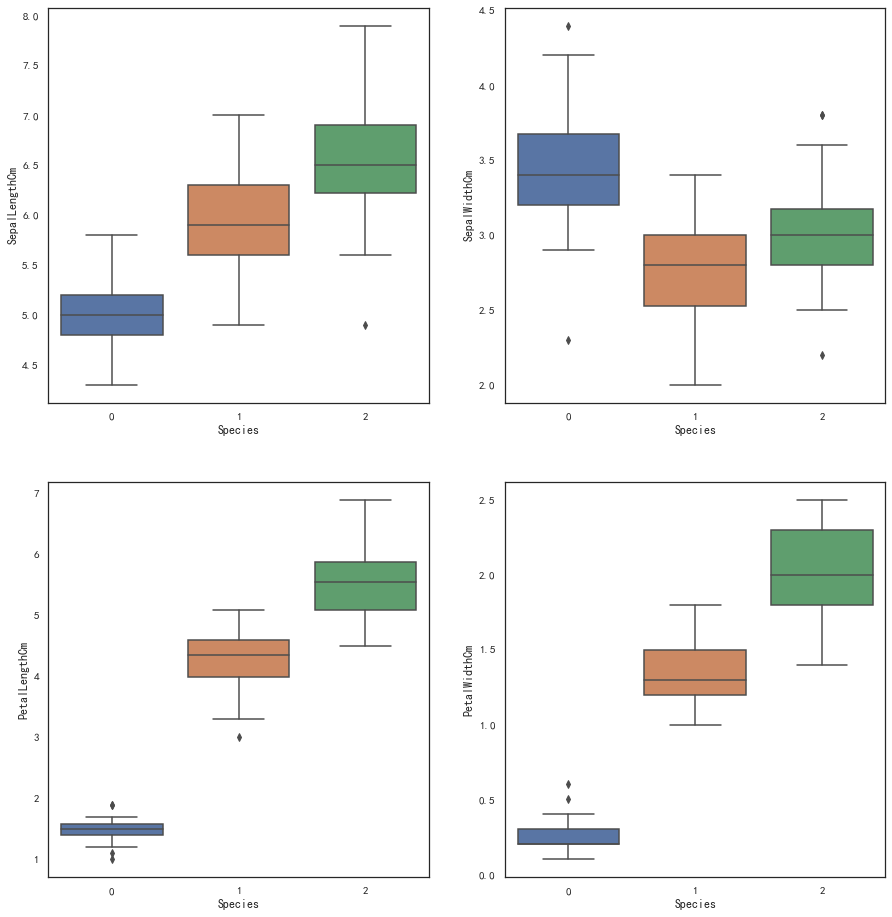
fig,axes = plt.subplots(2,2,figsize=(15,16))
sns.boxplot(x="Species", y="SepalLengthCm", data=iris_df,ax=axes[0,0])
sns.boxplot(x="Species", y="SepalWidthCm", data=iris_df,ax=axes[0,1])
sns.boxplot(x="Species", y="PetalLengthCm", data=iris_df,ax=axes[1,0])
sns.boxplot(x="Species", y="PetalWidthCm", data=iris_df,ax=axes[1,1])
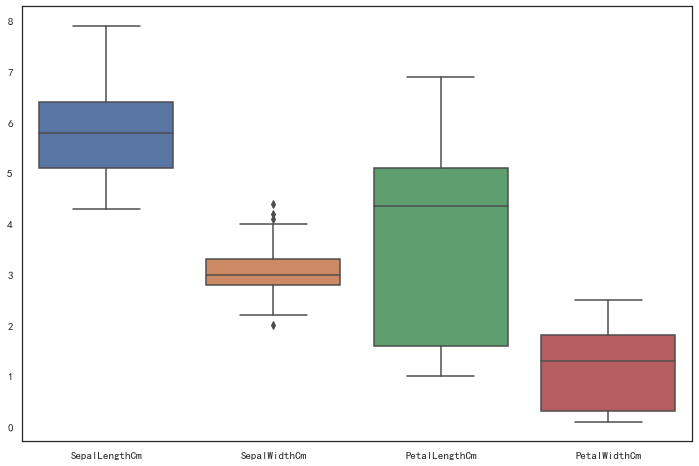
fig,axes = plt.subplots(figsize=(12,8))
sns.boxplot(data=iris_df.drop('Species',axis=1))
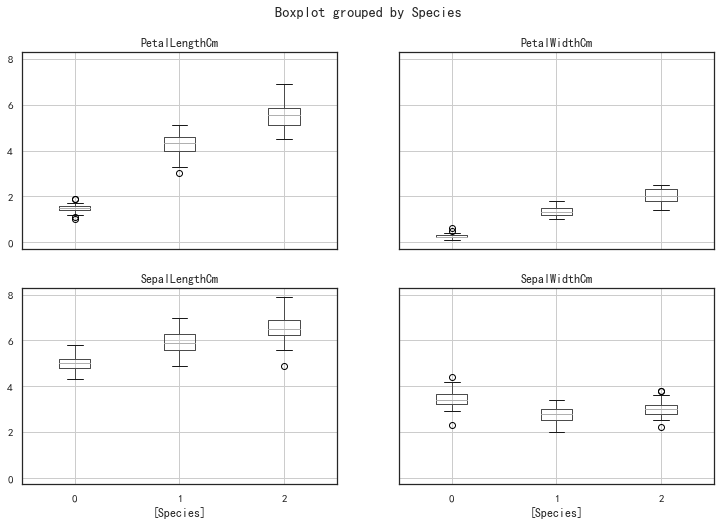
# 用pandas实现上面的箱式图如下
iris_df.boxplot(by="Species", figsize=(12, 8))
iris_df.drop('Species',axis=1).boxplot(figsize=(12, 8))
array([[,
        ],
       [,
        ]],
      dtype=object)
iris_df.drop('Species',axis=1).plot(kind='box',subplots=True,layout=(2,2),sharex=False,figsize=(15,8))
SepalLengthCm       AxesSubplot(0.125,0.536818;0.352273x0.343182)
SepalWidthCm     AxesSubplot(0.547727,0.536818;0.352273x0.343182)
PetalLengthCm          AxesSubplot(0.125,0.125;0.352273x0.343182)
PetalWidthCm        AxesSubplot(0.547727,0.125;0.352273x0.343182)
dtype: object
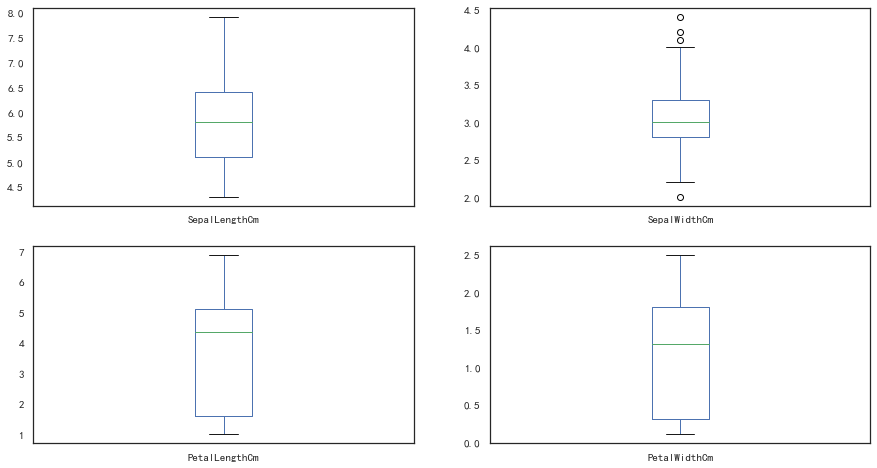
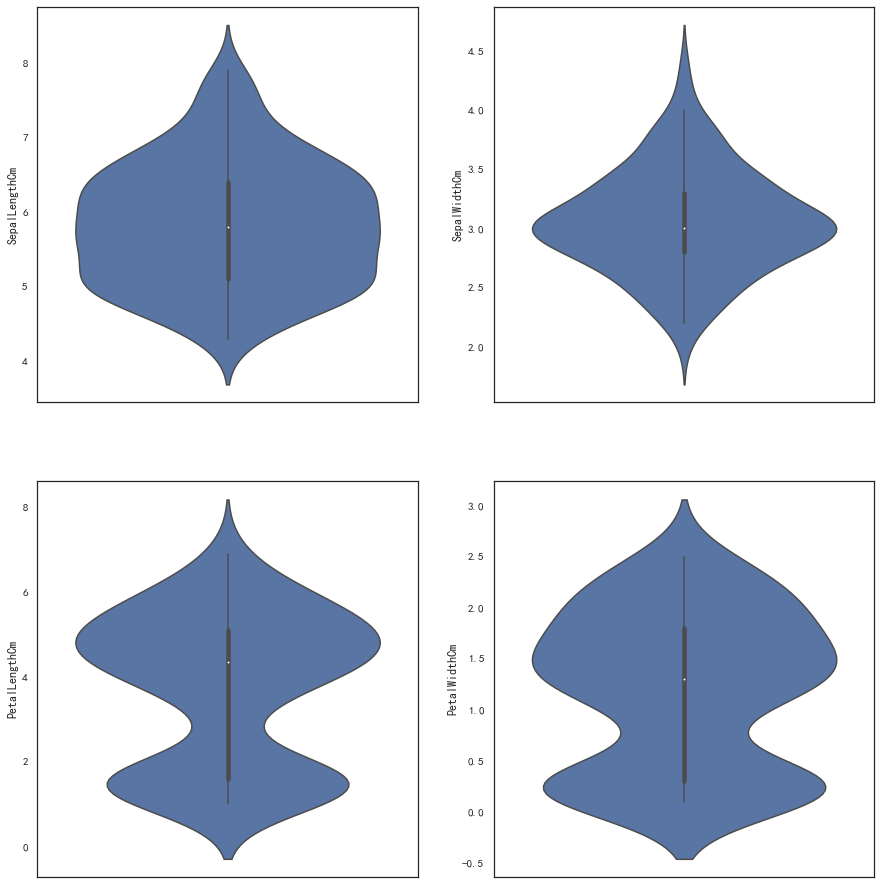
绘制小提琴图(同箱型图类似)
fig,axes = plt.subplots(2,2,figsize=(15,16))
sns.violinplot(y=iris_df['SepalLengthCm'],ax=axes[0,0])
sns.violinplot(y=iris_df['SepalWidthCm'],ax=axes[0,1])
sns.violinplot(y=iris_df['PetalLengthCm'],ax=axes[1,0])
sns.violinplot(y=iris_df['PetalWidthCm'],ax=axes[1,1])
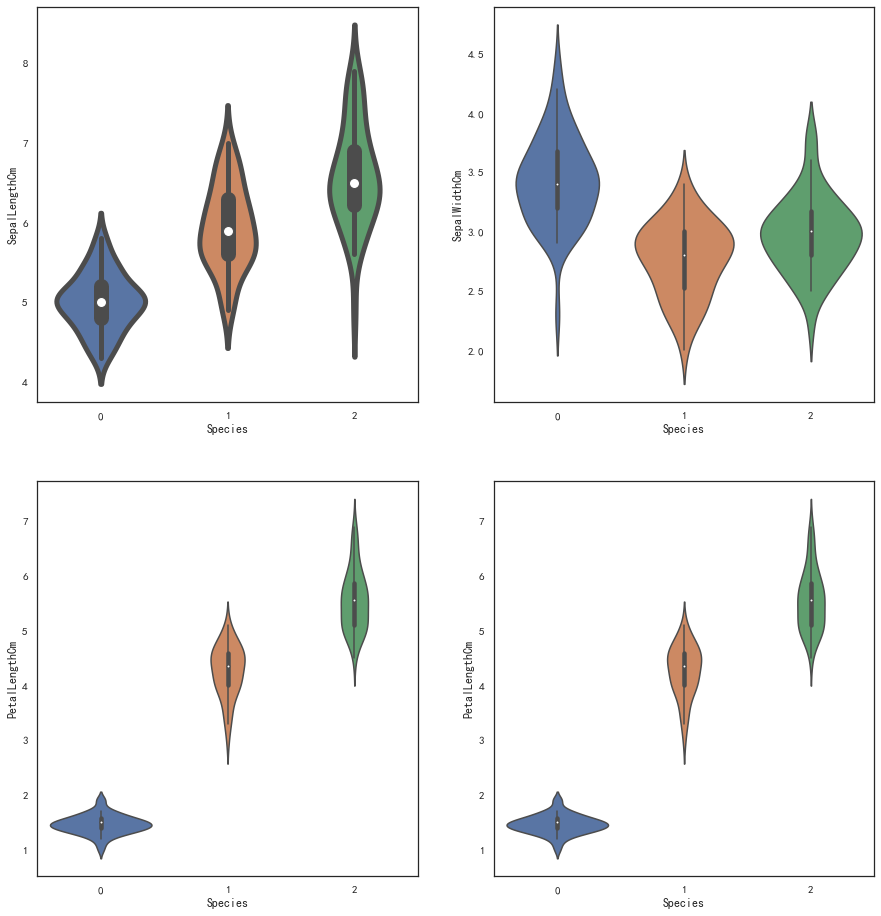
fig,axes = plt.subplots(2,2,figsize=(15,16))
sns.violinplot(x=iris_df['Species'],y=iris_df['SepalLengthCm'],ax=axes[0,0],linewidth=5,width=0.7)
sns.violinplot(x=iris_df['Species'],y=iris_df['SepalWidthCm'],ax=axes[0,1])
sns.violinplot(x=iris_df['Species'],y=iris_df['PetalLengthCm'],ax=axes[1,0])
sns.violinplot(x=iris_df['Species'],y=iris_df['PetalLengthCm'],ax=axes[1,1])
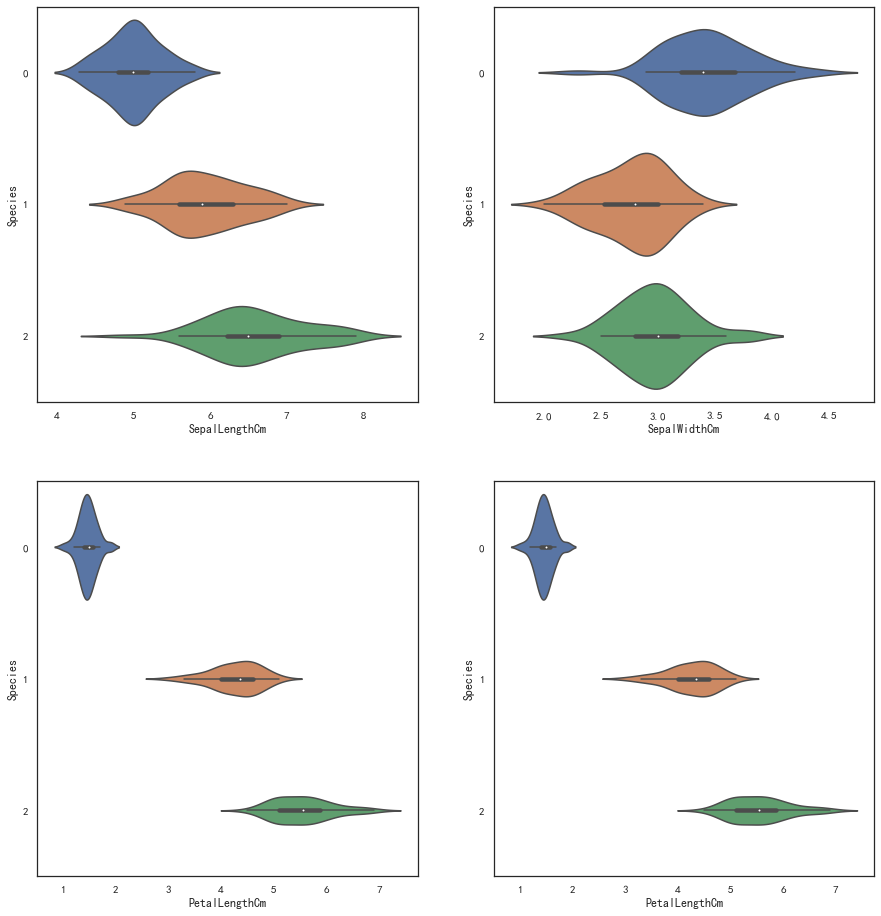
fig,axes = plt.subplots(2,2,figsize=(15,16))
sns.violinplot(y=iris_df['Species'],x=iris_df['SepalLengthCm'],ax=axes[0,0],orient='horizon')
sns.violinplot(y=iris_df['Species'],x=iris_df['SepalWidthCm'],ax=axes[0,1],orient='horizon')
sns.violinplot(y=iris_df['Species'],x=iris_df['PetalLengthCm'],ax=axes[1,0],orient='horizon')
sns.violinplot(y=iris_df['Species'],x=iris_df['PetalLengthCm'],ax=axes[1,1],orient='horizon')
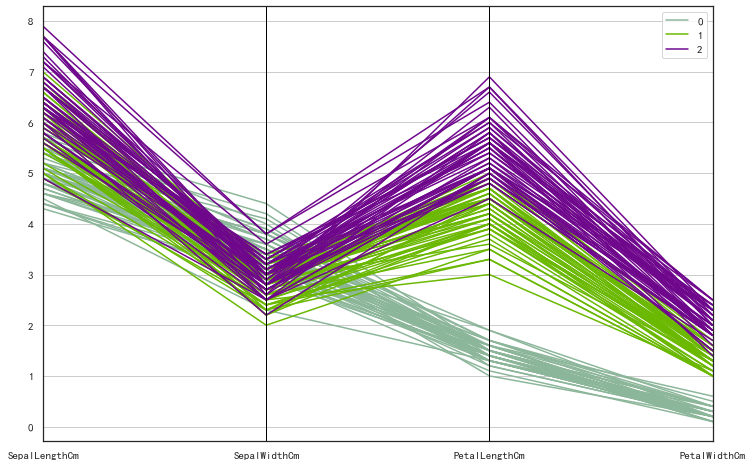
平行坐标图
平行坐标图是可视化高维数据的常用方法。
from pandas.plotting import parallel_coordinates
plt.subplots(1,1,figsize=(12,8))
parallel_coordinates(iris_df,'Species')
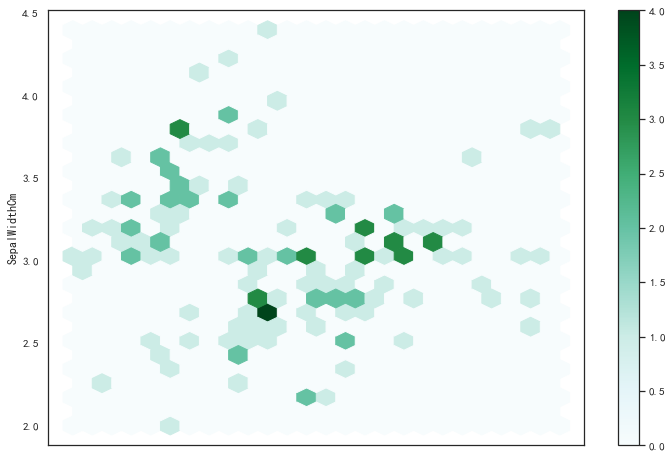
六边形蜂窝图(颜色越深表示符合这个区间的数据越多)
iris_df.plot.hexbin(x='SepalLengthCm',y='SepalWidthCm',gridsize=25,figsize=(12,8))
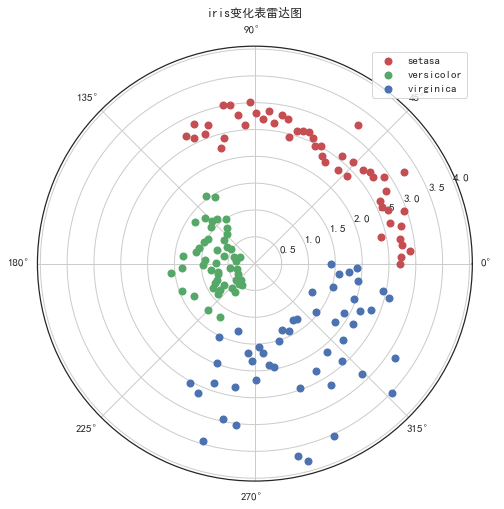
雷达图(径向坐标可视化)
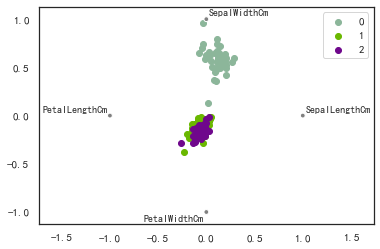
RadViz雷达图(径向坐标可视化)是一种可视化多为数据的方式。
本质是将多维特征降维压缩到二维,每个数据压缩为一个点。它基于基本的弹簧压力最小化算法。
dataLenth=149
# 设置雷达图的角度,用于平分切开一个圆面,dataLenth是一个变量,指属性个数,可以自己设置,是将圆分成多少块
angles = np.linspace(0,2*np.pi,dataLenth,endpoint=False)
# 也是为了雷达图封闭起来
data=X_p
data = np.concatenate((data,[data[0]]))
# 为了使雷达图一圈封闭起来
angles = np.concatenate((angles,[angles[0]]))
# 用来设置画布大小
fig = plt.figure(figsize=(12,8))
# 这里一定要设置成极坐标格式
ax = fig.add_subplot(111,polar=True)
# 绘制折线图
juli = np.sqrt(np.sum(X_p**2,axis=1)) # X_p每一个点到(0,0)的距离
juli0=juli[iris.target==0]
juli1=juli[iris.target==1]
juli2=juli[iris.target==2]
angles0=angles[iris.target==0]
angles1=angles[iris.target==1]
angles2=angles[iris.target==2]
plt.scatter(angles0,juli0,c='r',linewidth=2,label='setasa')
plt.scatter(angles1,juli1,c='g',linewidth=2,label='versicolor')
plt.scatter(angles2,juli2,c='b',linewidth=2,label='virginica')
# 添加每个特征的标签
ax.legend()
# 添加标题形式
ax.set_title("iris变化表雷达图",va='bottom',fontproperties="SimHei")
# 添加网格线
ax.grid(True)
#radviz(iris_df,'Species')
from pandas.plotting import radviz
radviz(iris_df,'Species')
#help(radviz)
from sklearn.decomposition import PCA
pca = PCA(n_components=2)
X_p =pca.fit(iris.data).transform(iris.data)
ax = plt.figure()
for c, i, target_name in zip("rgb", [0, 1, 2], iris.target_names):
    plt.scatter(X_p[y == i, 0], X_p[y == i, 1], c=c, label=target_name)
plt.xlabel('Dimension1')
plt.ylabel('Dimension2')
plt.title("Iris")
plt.legend()
plt.show()
y
array([0, 0, 0, 0, 0, 0, 0, 0, 0, 0, 0, 0, 0, 0, 0, 0, 0, 0, 0, 0, 0, 0,
       0, 0, 0, 0, 0, 0, 0, 0, 0, 0, 0, 0, 0, 0, 0, 0, 0, 0, 0, 0, 0, 0,
       0, 0, 0, 0, 0, 0, 1, 1, 1, 1, 1, 1, 1, 1, 1, 1, 1, 1, 1, 1, 1, 1,
       1, 1, 1, 1, 1, 1, 1, 1, 1, 1, 1, 1, 1, 1, 1, 1, 1, 1, 1, 1, 1, 1,
       1, 1, 1, 1, 1, 1, 1, 1, 1, 1, 1, 1, 2, 2, 2, 2, 2, 2, 2, 2, 2, 2,
       2, 2, 2, 2, 2, 2, 2, 2, 2, 2, 2, 2, 2, 2, 2, 2, 2, 2, 2, 2, 2, 2,
       2, 2, 2, 2, 2, 2, 2, 2, 2, 2, 2, 2, 2, 2, 2, 2, 2, 2])
X_p.shape
(150, 2)
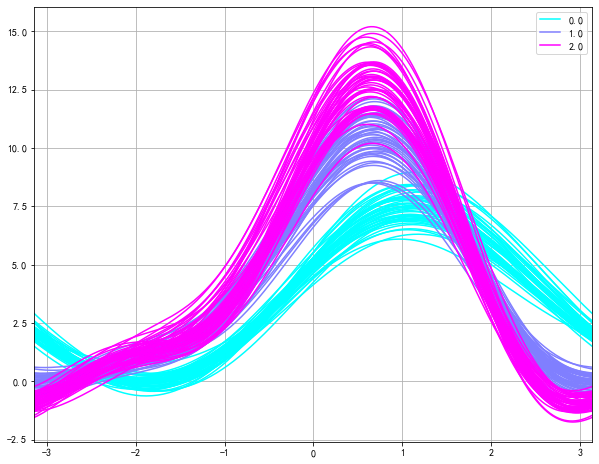
安德鲁斯曲线
安德鲁斯曲线就是将每个样本的属性值转化为傅里叶序列的系数来绘制曲线。
# Andrews曲线涉及使用样本的属性作为傅立叶级数的系数,然后进行绘制
from pandas.plotting import andrews_curves
plt.figure(figsize=(10,8))
andrews_curves(iris_df, 'Species',colormap='cool')
作者:xxuffei