你看你也懂,seaborn强加matplotlib的进阶模式
这是一份关于seaborn 和matplotlib 的进阶笔记,我个人觉得画图还是用seaborn,相对更简单上手一点。这里面的函数我还有很多没找到,有些我也不是很知道里面参数具体有什么,能干什么,不过这些基本操作也能对你我有所帮助,有一起学习这方面知识的朋友可以留个言,我们一起加油吧!!
进阶模式函数库显示中文数据预览折线图seaborn中的errorbar折线图条形图seaborn中的countplot条形图seaborn中的barplot条形图 这里用来图形调整seaborn中barplot条形图 这里用来计算缺失值统计seaborn中的pointplot平均值图分组条形图seaborn中的countpolt分组条形图饼图plt中的pie图和扩展环图直方图plt中的hist直方图seaborn 中的distplot直方图散点图plt中的scatter散点图seaborn中的regplot散点图热图plt中的hist2d热图seaborn 中的heatmap热图小提琴图 和 箱线图seaborn 中的violinplot 小提琴图seaborn中 boxplot 箱线图绝对频率和相对频率标尺和变化分面高阶模式: 函数库import matplotlib
from matplotlib import pyplot as plt
import numpy as np
import seaborn as sns
import pandas as pd
%matplotlib inline
显示中文
matplotlib.rcParams['font.family'] = 'SimSun'
matplotlib.rcParams['font.sans-serif'] = ['SimSun']
# 显示中文字体
数据预览
pok_mon = pd.read_csv('pokemon.csv')
pok_mon.head()
| id | species | generation_id | height | weight | base_experience | type_1 | type_2 | hp | attack | defense | speed | special-attack | special-defense | |
|---|---|---|---|---|---|---|---|---|---|---|---|---|---|---|
| 0 | 1 | bulbasaur | 1 | 0.7 | 6.9 | 64 | grass | poison | 45 | 49 | 49 | 45 | 65 | 65 |
| 1 | 2 | ivysaur | 1 | 1.0 | 13.0 | 142 | grass | poison | 60 | 62 | 63 | 60 | 80 | 80 |
| 2 | 3 | venusaur | 1 | 2.0 | 100.0 | 236 | grass | poison | 80 | 82 | 83 | 80 | 100 | 100 |
| 3 | 4 | charmander | 1 | 0.6 | 8.5 | 62 | fire | NaN | 39 | 52 | 43 | 65 | 60 | 50 |
| 4 | 5 | charmeleon | 1 | 1.1 | 19.0 | 142 | fire | NaN | 58 | 64 | 58 | 80 | 80 | 65 |
ful_econ = pd.read_csv(r'fuel_econ.csv')
ful_econ.head()
| id | make | model | year | VClass | drive | trans | fuelType | cylinders | displ | pv2 | pv4 | city | UCity | highway | UHighway | comb | co2 | feScore | ghgScore | |
|---|---|---|---|---|---|---|---|---|---|---|---|---|---|---|---|---|---|---|---|---|
| 0 | 32204 | Nissan | GT-R | 2013 | Subcompact Cars | All-Wheel Drive | Automatic (AM6) | Premium Gasoline | 6 | 3.8 | 79 | 0 | 16.4596 | 20.2988 | 22.5568 | 30.1798 | 18.7389 | 471 | 4 | 4 |
| 1 | 32205 | Volkswagen | CC | 2013 | Compact Cars | Front-Wheel Drive | Automatic (AM-S6) | Premium Gasoline | 4 | 2.0 | 94 | 0 | 21.8706 | 26.9770 | 31.0367 | 42.4936 | 25.2227 | 349 | 6 | 6 |
| 2 | 32206 | Volkswagen | CC | 2013 | Compact Cars | Front-Wheel Drive | Automatic (S6) | Premium Gasoline | 6 | 3.6 | 94 | 0 | 17.4935 | 21.2000 | 26.5716 | 35.1000 | 20.6716 | 429 | 5 | 5 |
| 3 | 32207 | Volkswagen | CC 4motion | 2013 | Compact Cars | All-Wheel Drive | Automatic (S6) | Premium Gasoline | 6 | 3.6 | 94 | 0 | 16.9415 | 20.5000 | 25.2190 | 33.5000 | 19.8774 | 446 | 5 | 5 |
| 4 | 32208 | Chevrolet | Malibu eAssist | 2013 | Midsize Cars | Front-Wheel Drive | Automatic (S6) | Regular Gasoline | 4 | 2.4 | 0 | 95 | 24.7726 | 31.9796 | 35.5340 | 51.8816 | 28.6813 | 310 | 8 | 8 |
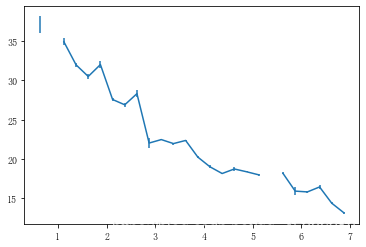
xbin_edges = np.arange(0.5, ful_econ['displ'].max()+0.25, 0.25)
xbin_centers = (xbin_edges + 0.25/2)[:-1]
# compute statistics in each bin
data_xbins = pd.cut(ful_econ['displ'], xbin_edges, right = False, include_lowest = True)
y_means = ful_econ['comb'].groupby(data_xbins).mean()
y_sems = ful_econ['comb'].groupby(data_xbins).sem()
plt.errorbar(x=xbin_centers, y=y_means, yerr=y_sems)
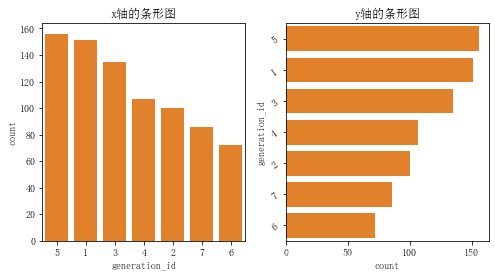
base_color = sns.color_palette()[1]  # 获得颜色元组 并且选择第二个作为返回值
base_order = pok_mon['generation_id'].value_counts().index # 排序 从大到小
plt.figure(figsize=[8, 4])
plt.subplot(1, 2, 1)  # 第一个
sns.countplot(data=pok_mon, x='generation_id', color=base_color, order=base_order)
plt.title('x轴的条形图')
plt.subplot(1, 2, 2)  # 第二个
sns.countplot(data=pok_mon, y='generation_id', color=base_color,order=base_order)
plt.title('y轴的条形图')
plt.yticks(rotation=35)  # y轴标签角度  与水平方向的逆时针夹角
plt.show()
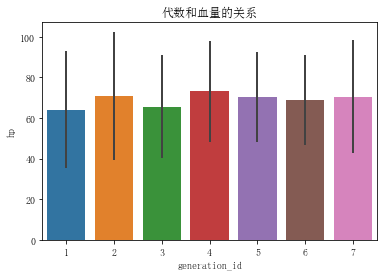
sns.barplot(data=pok_mon, x='generation_id', y='hp',errwidth=2, ci='sd')  # errwidth 设置误差线的粗细 0 表示无  ci设置数 这里标准差
plt.title('代数和血量的关系')
plt.show()
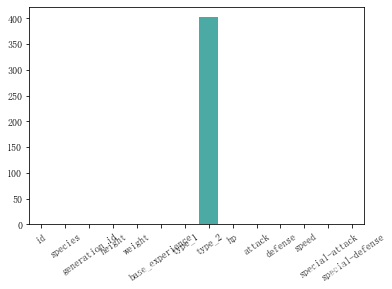
na_count = pok_mon.isna().sum()
sns.barplot(na_count.index.values, na_count)
# 第一个参数为列名称, 第二个参数为y值
plt.xticks(rotation = 35)
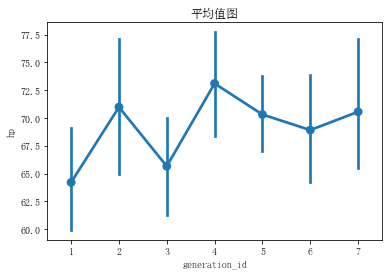
sns.pointplot(data=pok_mon, x='generation_id', y='hp') #linestyles = ''可以删除折线
plt.title('平均值图')
plt.show()
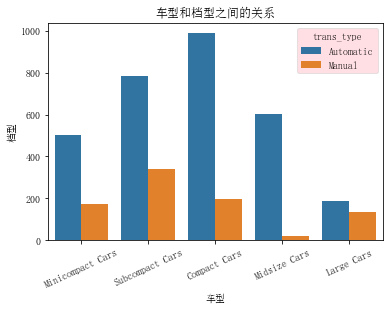
ful_econ['trans_type'] = ful_econ['trans'].apply(lambda x:x.split()[0]) # 数据分离
ax = sns.countplot(data=ful_econ, x='VClass', hue='trans_type')
plt.title('车型和档型之间的关系')
plt.xlabel('车型')
plt.ylabel('档型')
car_list = ['Minicompact Cars', 'Subcompact Cars', 'Compact Cars', 'Midsize Cars', 'Large Cars']
plt.xticks([ i for i in range(len(set(ful_econ['VClass'])))], car_list, rotation=25)
ax.legend(loc=1, ncol=1,framealpha=0.5,title='trans_type',facecolor='pink') # 更改图例位置  位置, 列数, 透明度, 标题, 颜色
plt.show()
·loc参数数值对应的图例位置·
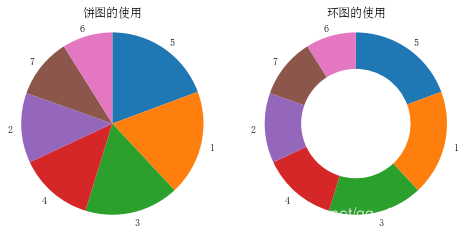
base_data = pok_mon['generation_id'].value_counts()
plt.figure(figsize=[8, 4])
plt.subplot(1, 2, 1)
plt.pie(base_data, labels=base_data.index,startangle=90, counterclock= False)
plt.axis('square')   # 确保x轴和y轴长度相同
plt.title('饼图的使用')
plt.subplot(1, 2, 2)
plt.pie(base_data,labels=base_data.index, startangle=90,counterclock=False, wedgeprops={'width':0.4})
plt.axis('square')
plt.title('环图的使用')
plt.show()
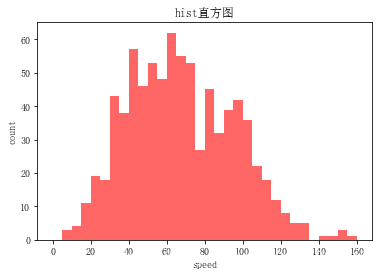
base_bins = np.arange(0, pok_mon['speed'].max()+5, 5)
plt.hist(data=pok_mon, x='speed', bins=base_bins, alpha=0.6, color='red')
plt.title('hist直方图')
plt.xlabel('speed')
plt.ylabel('count')
plt.show()
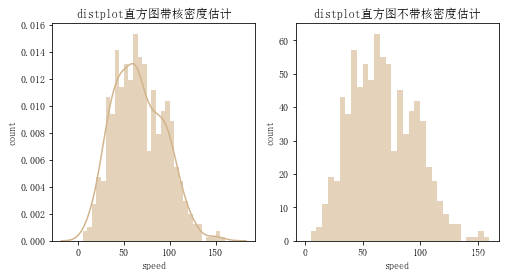
plt.figure(figsize=[8, 4])
plt.subplot(1, 2, 1)
sns.distplot(pok_mon['speed'], bins=base_bins, kde=True, hist_kws={'alpha':0.6}, color='Tan')
plt.title('distplot直方图带核密度估计')
plt.xlabel('speed')
plt.ylabel('count')
plt.subplot(1, 2,2)
sns.distplot(pok_mon['speed'],bins=base_bins, kde=False, hist_kws={'alpha':0.6}, color='Tan')
plt.title('distplot直方图不带核密度估计')
plt.xlabel('speed')
plt.ylabel('count')
plt.show()
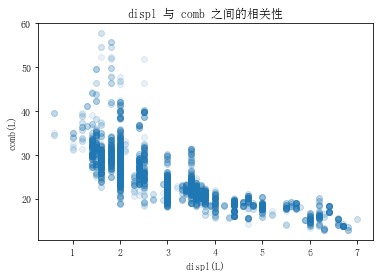
plt.scatter(data=ful_econ, x='displ', y='comb', alpha=1 / 10)
plt.title('displ 与 comb 之间的相关性')
plt.xlabel('displ(L)')
plt.ylabel('comb(L)')
plt.show()
sns.regplot(data=ful_econ, x='displ', y='comb', fit_reg=True, scatter_kws={'alpha':1/5}, x_jitter=0.02)
plt.title('displ 与 comb 之间的相关性')
plt.xlabel('displ(L)')
plt.ylabel('comb(L)')
plt.show()
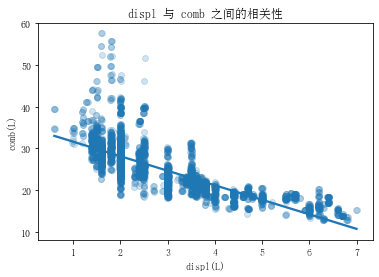
透明度: alpha 介于(0 - 1) 之间的数值,具体用法如上: 回归曲线: fit_reg 默认打开为True 关闭设置为False 抖动: x_jitter, y_jitter : 可以沿着x或者y轴每个值在真实值范围抖动
ful_econ[['displ', 'comb']].describe()
| displ | comb | |
|---|---|---|
| count | 3929.000000 | 3929.000000 |
| mean | 2.950573 | 24.791339 |
| std | 1.305901 | 6.003246 |
| min | 0.600000 | 12.821700 |
| 25% | 2.000000 | 20.658100 |
| 50% | 2.500000 | 24.000000 |
| 75% | 3.600000 | 28.227100 |
| max | 7.000000 | 57.782400 |
plt.figure(figsize=[8, 4])
plt.subplot(1, 2, 1)
bins_x = np.arange(0.6, 7+0.5, 0.5)
bins_y = np.arange(12, 58+5, 5)
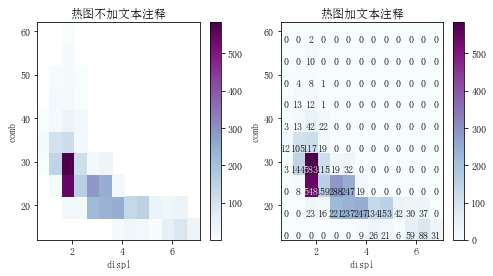
plt.hist2d(data=ful_econ, x='displ', y='comb', bins=[bins_x, bins_y],cmap='BuPu',cmin=0.5)
plt.colorbar()  #  颜色对应条
plt.title('热图不加文本注释')
plt.xlabel('displ')
plt.ylabel('comb')
plt.subplot(1, 2, 2)
ax = plt.hist2d(data=ful_econ, x='displ', y='comb', bins=[bins_x, bins_y],cmap='BuPu')
plt.colorbar()  #  颜色对应条
plt.title('热图加文本注释')
plt.xlabel('displ')
plt.ylabel('comb')
count = ax[0]
# 加入文本注释
for i in range(count.shape[0]):
    for j in range(count.shape[1]):
        c = count[i, j]
        if c > 400:  #  对数据关系大的换颜色
            plt.text(bins_x[i]+0.2, bins_y[j]+1.2, int(c), ha='center',va='center',color='white')
        else:  # 对数据小的换颜色
            plt.text(bins_x[i]+0.2, bins_y[j]+1.2, int(c), ha='center',va='center',color= 'black')
plt.show()
调色板网址
fu_counts = ful_econ.groupby(['VClass', 'trans_type']).size()  # se分组获得series对象
fu_counts = fu_counts.reset_index(name='count')  # 转换为df对象
fu_counts = fu_counts.pivot(index='VClass', columns='trans_type', values='count') # 载入数据
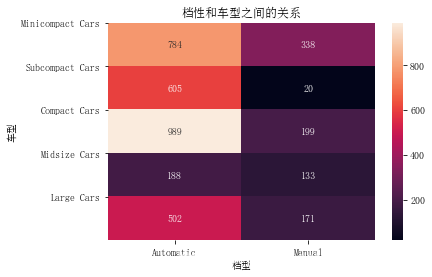
sns.heatmap(fu_counts, annot=True, fmt='d')  # annot 显示注释 fmt数字规格 当fmt = '.0f' 可以显示NaN值
plt.title('档性和车型之间的关系')
plt.xlabel('档型')
plt.ylabel('车型')
car_list = ['Minicompact Cars', 'Subcompact Cars', 'Compact Cars', 'Midsize Cars', 'Large Cars']
plt.yticks([ i for i in range(len(set(ful_econ['VClass'])))], car_list)
plt.show()
ful_econ.head()
| id | make | model | year | VClass | drive | trans | fuelType | cylinders | displ | pv2 | pv4 | city | UCity | highway | UHighway | comb | co2 | feScore | ghgScore | |
|---|---|---|---|---|---|---|---|---|---|---|---|---|---|---|---|---|---|---|---|---|
| 0 | 32204 | Nissan | GT-R | 2013 | Subcompact Cars | All-Wheel Drive | Automatic (AM6) | Premium Gasoline | 6 | 3.8 | 79 | 0 | 16.4596 | 20.2988 | 22.5568 | 30.1798 | 18.7389 | 471 | 4 | 4 |
| 1 | 32205 | Volkswagen | CC | 2013 | Compact Cars | Front-Wheel Drive | Automatic (AM-S6) | Premium Gasoline | 4 | 2.0 | 94 | 0 | 21.8706 | 26.9770 | 31.0367 | 42.4936 | 25.2227 | 349 | 6 | 6 |
| 2 | 32206 | Volkswagen | CC | 2013 | Compact Cars | Front-Wheel Drive | Automatic (S6) | Premium Gasoline | 6 | 3.6 | 94 | 0 | 17.4935 | 21.2000 | 26.5716 | 35.1000 | 20.6716 | 429 | 5 | 5 |
| 3 | 32207 | Volkswagen | CC 4motion | 2013 | Compact Cars | All-Wheel Drive | Automatic (S6) | Premium Gasoline | 6 | 3.6 | 94 | 0 | 16.9415 | 20.5000 | 25.2190 | 33.5000 | 19.8774 | 446 | 5 | 5 |
| 4 | 32208 | Chevrolet | Malibu eAssist | 2013 | Midsize Cars | Front-Wheel Drive | Automatic (S6) | Regular Gasoline | 4 | 2.4 | 0 | 95 | 24.7726 | 31.9796 | 35.5340 | 51.8816 | 28.6813 | 310 | 8 | 8 |
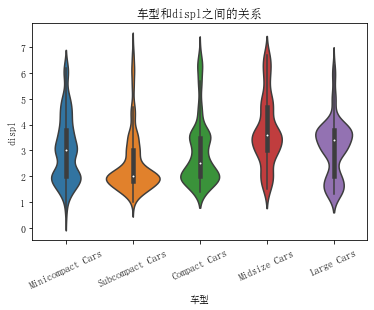
sns.violinplot(data=ful_econ, x='VClass', y='displ')  # 加入参数 inner = None 可以去掉中间的小型箱线图
plt.title('车型和displ之间的关系')                      # 加入参数 inner = 'quartile’ 可以增加四等分线图
plt.xlabel('车型')
car_list = ['Minicompact Cars', 'Subcompact Cars', 'Compact Cars', 'Midsize Cars', 'Large Cars']
plt.xticks([ i for i in range(len(set(ful_econ['VClass'])))], car_list, rotation=25)
plt.show()
sns.boxplot(data=ful_econ, x='VClass', y='displ')
plt.title('车型和displ之间的关系')
plt.xlabel('车型')
car_list = ['Minicompact Cars', 'Subcompact Cars', 'Compact Cars', 'Midsize Cars', 'Large Cars']  # 排序列表
plt.xticks([ i for i in range(len(set(ful_econ['VClass'])))], car_list, rotation=25)
plt.show()
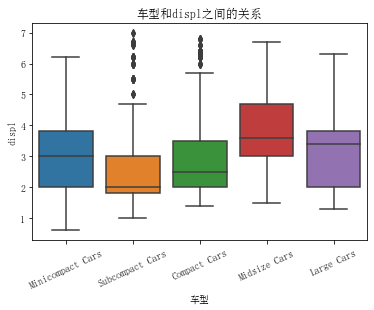
箱线图说明:箱子中间那个线是数据的中位数,上面那个线是第三个四等分点,下面那个线是第一个四等分点,上下二根线是最大值和最小值。
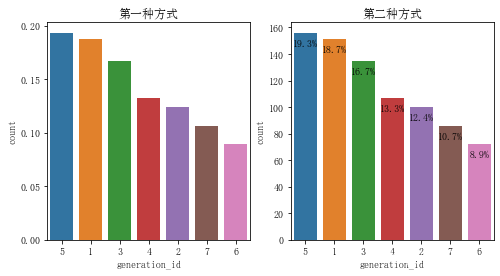
就是对数据表达的二种方式,分别作用在标签或者长条上,我个人倾向后者的使用
base_order = pok_mon['generation_id'].value_counts().index
plt.figure(figsize=[8, 4])
plt.subplot(1, 2, 1) # 作用在标签内
n_max = pok_mon['generation_id'].value_counts().max()  # 获得比例最大的数量
n_sum = pok_mon['generation_id'].shape[0]  # 总数
n_sca = n_max / n_sum
n_loc = np.arange(0, n_sca+0.01, 0.05) # 位置
n_label = ['{:.2f}'.format(i) for i in n_loc] # 标签
sns.countplot(data=pok_mon, x='generation_id', order=base_order)
plt.title('第一种方式')
plt.yticks(n_loc * n_sum, n_label)
plt.subplot(1, 2, 2) # 作用在长条内
sns.countplot(data=pok_mon, x='generation_id',order=base_order)
locs, labels = plt.xticks()
id_base = pok_mon['generation_id'].value_counts()  # 索引
for loc,label in zip(locs, labels):  # 使用text追加到每个长条内
    count = id_base[eval(label.get_text())]   #  获得标签对应的值
    sts = '{:0.1f}%'.format(100 * count / n_sum)
    print(sts)
    plt.text(loc, count - 10,sts, ha='center', color='black')
plt.title('第二种方式')
plt.show()
19.3%
18.7%
16.7%
13.3%
12.4%
10.7%
8.9%
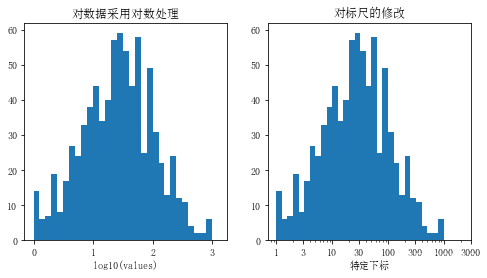
plt.figure(figsize=[8, 4])
plt.subplot(1, 2, 1)
log_pk = np.log10(pok_mon['weight'])
log_bins = np.arange(0, log_pk.max() + 0.11, 0.1)
plt.hist(log_pk, bins=log_bins)
plt.xlabel('log10(values)')
plt.title('对数据采用对数处理')
plt.subplot(1, 2, 2)
bins =10 ** np.arange(0, np.log10(pok_mon['weight'].max())+0.1, 0.1)
plt.hist(data=pok_mon, x='weight', bins=bins)
plt.xscale('log')  #  缩放log10倍
col = [1, 3, 10, 30, 100, 300, 1000, 3000]
plt.title('对标尺的修改')
plt.xticks(col, col)
plt.xlabel('特定下标')
plt.show()
分面是一种通用的可视化技巧,帮助你处理包含两个或多个变量的图表。在分面操作中, 数据被划分为不相交的子集,通常根据分类变量的不同类别进行划分。 对于每个子集,对其他变量绘制相同的图表。分面是比较不同变量级别分布或关系的一种方式,尤其是有三个或多个感兴趣的变量时。
ful_econ.head()
| id | make | model | year | VClass | drive | trans | fuelType | cylinders | displ | ... | pv4 | city | UCity | highway | UHighway | comb | co2 | feScore | ghgScore | trans_type | |
|---|---|---|---|---|---|---|---|---|---|---|---|---|---|---|---|---|---|---|---|---|---|
| 0 | 32204 | Nissan | GT-R | 2013 | Subcompact Cars | All-Wheel Drive | Automatic (AM6) | Premium Gasoline | 6 | 3.8 | ... | 0 | 16.4596 | 20.2988 | 22.5568 | 30.1798 | 18.7389 | 471 | 4 | 4 | Automatic |
| 1 | 32205 | Volkswagen | CC | 2013 | Compact Cars | Front-Wheel Drive | Automatic (AM-S6) | Premium Gasoline | 4 | 2.0 | ... | 0 | 21.8706 | 26.9770 | 31.0367 | 42.4936 | 25.2227 | 349 | 6 | 6 | Automatic |
| 2 | 32206 | Volkswagen | CC | 2013 | Compact Cars | Front-Wheel Drive | Automatic (S6) | Premium Gasoline | 6 | 3.6 | ... | 0 | 17.4935 | 21.2000 | 26.5716 | 35.1000 | 20.6716 | 429 | 5 | 5 | Automatic |
| 3 | 32207 | Volkswagen | CC 4motion | 2013 | Compact Cars | All-Wheel Drive | Automatic (S6) | Premium Gasoline | 6 | 3.6 | ... | 0 | 16.9415 | 20.5000 | 25.2190 | 33.5000 | 19.8774 | 446 | 5 | 5 | Automatic |
| 4 | 32208 | Chevrolet | Malibu eAssist | 2013 | Midsize Cars | Front-Wheel Drive | Automatic (S6) | Regular Gasoline | 4 | 2.4 | ... | 95 | 24.7726 | 31.9796 | 35.5340 | 51.8816 | 28.6813 | 310 | 8 | 8 | Automatic |
5 rows × 21 columns
bins = np.arange(12, 58+2, 2)
g = sns.FacetGrid(data=ful_econ, col='VClass', col_wrap=3) # col_wrap 设置一行放置多少图
g.map(plt.hist, 'comb',bins=bins)
g.set_titles('{col_name}')  # 为每个子图加上标题
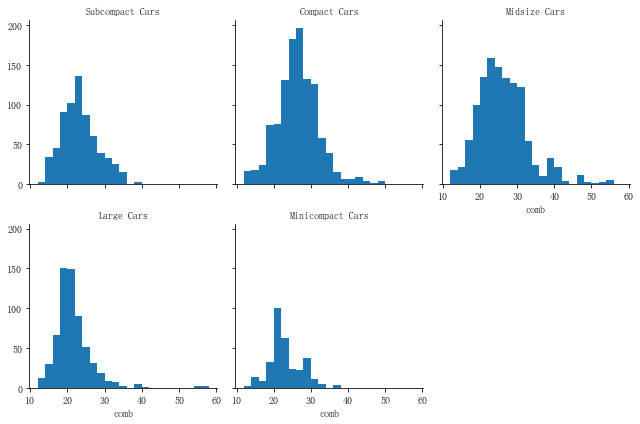
# FacetGrid中其他参数 sharey(sharex) = False 增加每个子图的行列标签 size 更改 每个子图的高度 hue参数设置分类变量,可以多次调用绘制hist或者其他图形
待定待定…
作者:沙漏在下雨