Python如何查看并打印matplotlib中所有的colormap(cmap)类型
目录
查看并打印matplotlib中所有的colormap(cmap)类型
方法一
方法二
方法三
matplotlib cmap取值问题
直接定义一个类来获取cmap中各个颜色方便使用
可视化官方提供的cmap
查看并打印matplotlib中所有的colormap(cmap)类型代码如下:
方法一import matplotlib.pyplot as plt
cmaps = sorted(m for m in plt.cm.datad if not m.endswith("_r"))
print(cmaps)
我们忽略以_r结尾的类型,因为它们都是类型后面不带有_r的反转版本(reversed version)。
所有的类型我们可以在matplotlib的源代码中找到:(如下图)

import matplotlib.pyplot as plt
cmap_list1 = plt.colormaps()
print(cmap_list1)
方法三
如果使用的是Pycharm编译器,那么可以在作图的时候简单的随便给定一个cmap的类型,如果给定的cmap类型是错误的,那么在编译器的错误提示信息中也会显示出所有的cmap类型。
比如,我们这里我们想要做一个高斯函数的曲面分布图,我们随意给cmap一个'aaa'的值,这时,我们可以在编译器提示窗口看到如下错误信息的输出。
import numpy as np
import matplotlib.pyplot as plt
from mpl_toolkits.mplot3d import Axes3D
x = np.linspace(-3, 3, 100)
y = np.linspace(-3, 3, 100)
x, y = np.meshgrid(x, y)
w0 = 1
gaussian = np.exp(-((pow(x, 2) + pow(y, 2)) / pow(w0, 2)))
fig = plt.figure()
ax = Axes3D(fig)
ax.plot_surface(x, y, gaussian, cmap='aaa')
ax.set_xlabel('X')
ax.set_ylabel('Y')
ax.set_zlabel('Z')
plt.show()
"""
错误提示信息:
ValueError: 'aaa' is not a valid value for name; supported values are 'Accent',
 'Accent_r', 'Blues', 'Blues_r', 'BrBG', 'BrBG_r', 'BuGn', 'BuGn_r', 'BuPu',
 'BuPu_r', 'CMRmap', 'CMRmap_r', 'Dark2', 'Dark2_r', 'GnBu', 'GnBu_r', 'Greens',
 'Greens_r', 'Greys', 'Greys_r', 'OrRd', 'OrRd_r', 'Oranges', 'Oranges_r',
 'PRGn', 'PRGn_r', 'Paired', 'Paired_r', 'Pastel1', 'Pastel1_r', 'Pastel2',
 'Pastel2_r', 'PiYG', 'PiYG_r', 'PuBu', 'PuBuGn', 'PuBuGn_r', 'PuBu_r', 'PuOr',
 'PuOr_r', 'PuRd', 'PuRd_r', 'Purples', 'Purples_r', 'RdBu', 'RdBu_r', 'RdGy',
 'RdGy_r', 'RdPu', 'RdPu_r', 'RdYlBu', 'RdYlBu_r', 'RdYlGn', 'RdYlGn_r', 'Reds',
 'Reds_r', 'Set1', 'Set1_r', 'Set2', 'Set2_r', 'Set3', 'Set3_r', 'Spectral',
 'Spectral_r', 'Wistia', 'Wistia_r', 'YlGn', 'YlGnBu', 'YlGnBu_r', 'YlGn_r',
 'YlOrBr', 'YlOrBr_r', 'YlOrRd', 'YlOrRd_r', 'afmhot', 'afmhot_r', 'autumn',
 'autumn_r', 'binary', 'binary_r', 'bone', 'bone_r', 'brg', 'brg_r', 'bwr',
 'bwr_r', 'cividis', 'cividis_r', 'cool', 'cool_r', 'coolwarm', 'coolwarm_r',
 'copper', 'copper_r', 'cubehelix', 'cubehelix_r', 'flag', 'flag_r','gist_earth',
 'gist_earth_r', 'gist_gray', 'gist_gray_r', 'gist_heat','gist_heat_r', 'gist_ncar',
 'gist_ncar_r', 'gist_rainbow', 'gist_rainbow_r','gist_stern', 'gist_stern_r',
 'gist_yarg', 'gist_yarg_r', 'gnuplot','gnuplot2', 'gnuplot2_r', 'gnuplot_r', 'gray',
 'gray_r', 'hot', 'hot_r', 'hsv', 'hsv_r', 'inferno', 'inferno_r', 'jet','jet_r',
 'magma', 'magma_r','nipy_spectral', 'nipy_spectral_r', 'ocean', 'ocean_r',
'pink', 'pink_r','plasma', 'plasma_r', 'prism', 'prism_r', 'rainbow', 'rainbow_r',
'seismic', 'seismic_r', 'spring', 'spring_r', 'summer', 'summer_r', 'tab10','tab10_r',
'tab20', 'tab20_r', 'tab20b', 'tab20b_r', 'tab20c', 'tab20c_r', 'terrain','terrain_r',
'turbo', 'turbo_r', 'twilight', 'twilight_r', 'twilight_shifted','twilight_shifted_r',
'viridis', 'viridis_r', 'winter', 'winter_r'
"""
matplotlib cmap取值问题
直接定义一个类来获取cmap中各个颜色方便使用
使用的话:mycolor = MyColor(‘Accent’); mycolor.get_color();# 每次就调用获取下一个cmap中的颜色。
class MyColor(object):
    def __init__(self, cmap_name):
        self.color_set  = plt.get_cmap(cmap_name).colors
        self.idx = 0
        self.color_len = len(self.color_set)
    def get_color(self):
        if self.idx == self.color_len - 1:
            self.idx = 0
        color = self.color_set[self.idx]
        self.idx += 1
        return color
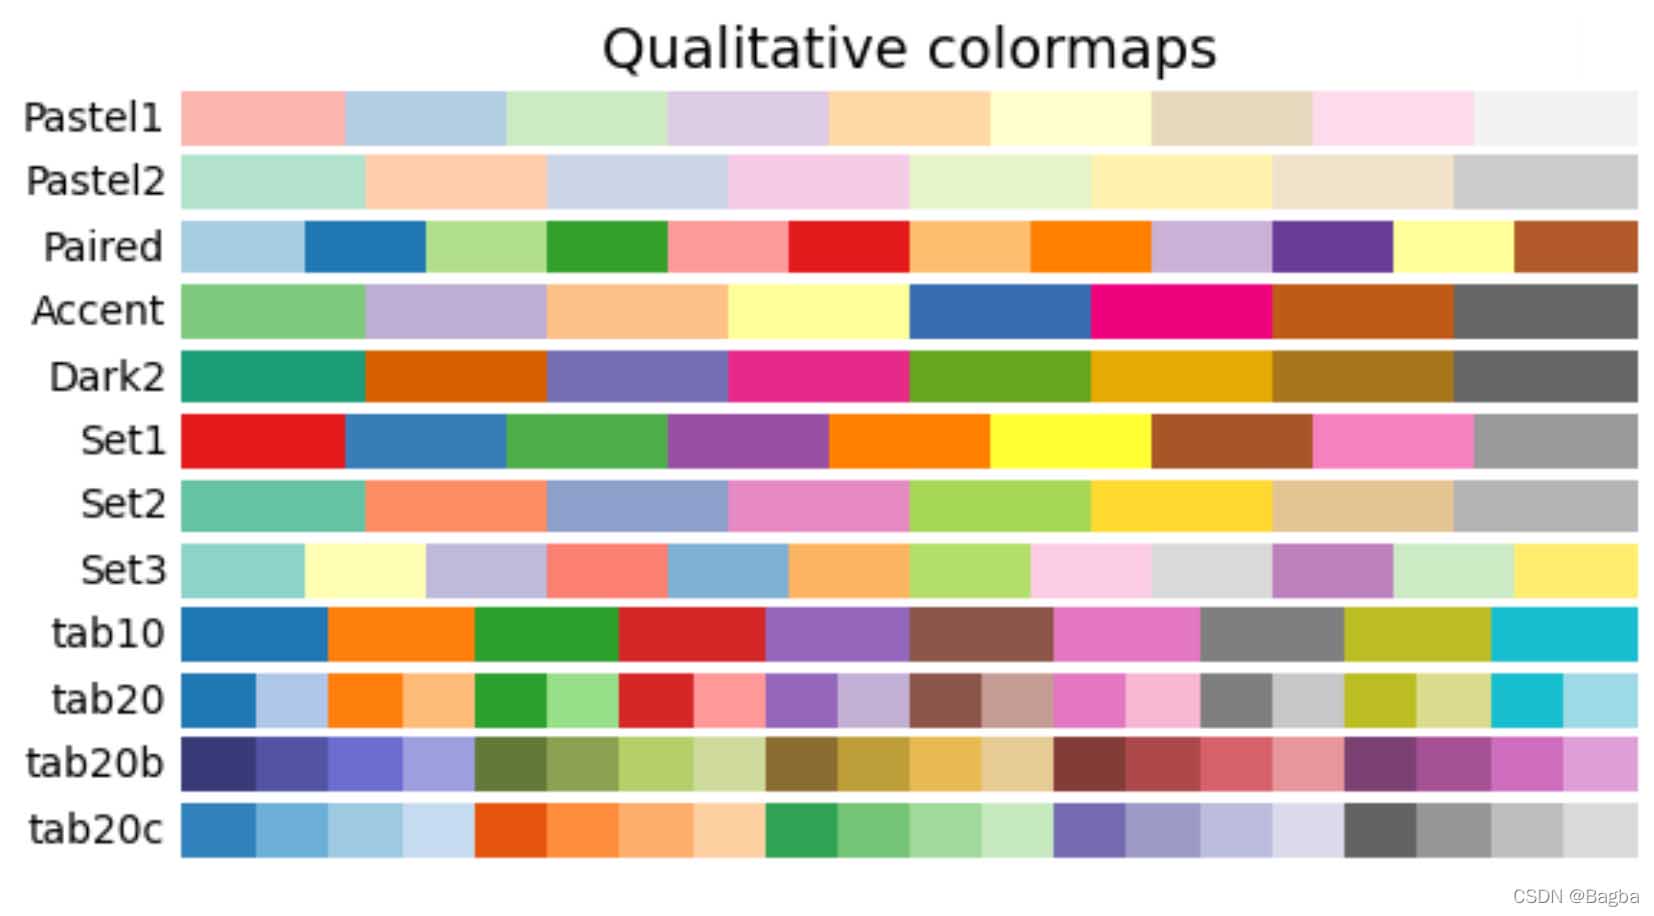
可视化官方提供的cmap
比如查看:[‘Pastel1’, ‘Pastel2’, ‘Paired’, ‘Accent’, ‘Dark2’, ‘Set1’, ‘Set2’, ‘Set3’, ‘tab10’, ‘tab20’, ‘tab20b’, ‘tab20c’]
import matplotlib.pyplot as plt
import numpy as np
import matplotlib.pyplot as plt
cmaps = {}
gradient = np.linspace(0, 1, 256)
gradient = np.vstack((gradient, gradient))
def plot_color_gradients(category, cmap_list):
    # Create figure and adjust figure height to number of colormaps
    nrows = len(cmap_list)
    figh = 0.35 + 0.15 + (nrows + (nrows - 1) * 0.1) * 0.22
    fig, axs = plt.subplots(nrows=nrows + 1, figsize=(6.4, figh), dpi=100)
    fig.subplots_adjust(top=1 - 0.35 / figh, bottom=0.15 / figh,
                        left=0.2, right=0.99)
    axs[0].set_title(f'{category} colormaps', fontsize=14)
    for ax, name in zip(axs, cmap_list):
        ax.imshow(gradient, aspect='auto', cmap=plt.get_cmap(name))
        ax.text(-0.01, 0.5, name, va='center', ha='right', fontsize=10,
                transform=ax.transAxes)
    # Turn off *all* ticks & spines, not just the ones with colormaps.
    for ax in axs:
        ax.set_axis_off()
    # Save colormap list for later.
    cmaps[category] = cmap_list
plot_color_gradients('Qualitative',
                     ['Pastel1', 'Pastel2', 'Paired', 'Accent', 'Dark2',
                      'Set1', 'Set2', 'Set3', 'tab10', 'tab20', 'tab20b',
                      'tab20c'])
运行后:

以上为个人经验,希望能给大家一个参考,也希望大家多多支持软件开发网。