matplotlib.pyplot笔记
由于使用emacs-org进行编辑,为方便暂且使用英文
Table of Contents basic point basic elements line graph axis: line markers method 1 method 2 method 3 legend, label and title grid get attributes histogram return instance pie chart instance bar graph instance distinguish between bar-graph and histogram scatter parameters instance subplot method subplot() method subplots() nrows, ncols: sharex, sharey: squeeze: return instance image fill stuffs colors xkcd-mode basic pointhold: whether to hold all lines on same picture,
or del previous lines when drawing new ones
axis: x, y, banners, scales, limits
gridline: .lw: linewidth, .alpha: alpha
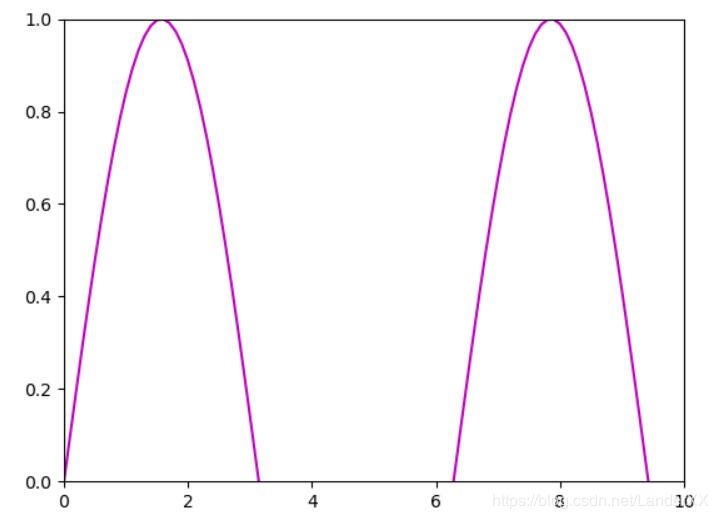
line graph axis:# simply use axis()
plt.axis([0, 10, 0, 1])
# or use following methods
plt.xlim(0, 10)
plt.ylim(0, 1)
linestyles
’-’ solid line style
’–’ dashed line style
’-.’ dash-dot line style
’:’ dotted line style
dot-markers
’.’ point marker
’,’ pixel marker
’o’ circle marker
’v’ triangle_down marker
’^’ triangle_up marker
’<’ triangle_left marker
’>’ triangle_right marker
’1’ tri_down marker
’2’ tri_up marker
’3’ tri_left marker
’4’ tri_right marker
’s’ square marker
’p’ pentagon marker
‘*’ star marker
’h’ hexagon1 marker
’H’ hexagon2 marker
’+’ plus marker
’x’ x marker
’D’ diamond marker
’d’ thin_diamond marker
’|’ vline marker
’_’ hline marker
colors
’b’ blue
’r’ red
’g’ green
’c’ cyan
’m’ magenta
’y’ yellow
’w’ white
’k’ black
linewidth
(real number)
method 1directly set in plot()
plt.plot(x, y, ',:m', linewidth = 0.2)
plt.plot(x, y, color = 'm', linestyle = ':', marker = ',',
               linewidth = 0.2)
plt.plot(x, y, color = 'magenta',
               linestyle = 'dotted',
               marker = 'pixel',
               linewidth = 0.2)
method 2
set with set()
line = plt.plot(range(5))[0]
line.set(color = 'm', linewidth = 0.2, )
method 3
set multiple lines with setp()
lines = plt.plot(range(5), range(8, 13))
plt.setp(lines, color = 'm', linewidth = 0.2, )
legend, label and title
remember to use legend() to activate labels
plt.plot(x, y, label = 'y = sinx')# set a legend
plt.legend()# activate
plt.xlabel('x axis')
plt.ylabel('y axis')
plt.title('sin() graph')
grid
plt.grid(True)
get attributesget_()
or getp()
plt.getp(line)
plt.getp(line, 'color')# get referred attribute
histogram
method hist()
n, bin, patches = \
hist(x, bins = 10, range = None, normed = False, weights = None,
     cumulative = False, bottom = None, histtype = 'bar',
     align = 'mid', orientation = 'vertical', rwidth = None,
     log = False, color = None, label = None, stacked = False,
     hold = None, data = None, **kwargs)
bin: how many rectangles
range: which rects to be drawn
normed: make the area sum to 1
weights: array-like, weights of each rect when counting area
bottom: array-like or scalar, move each rect or all rects
up(down) by bottom-value
histtype:
‘bar’: traditional
‘barstacked’: stack up when x is multiple input (list of list)
‘step’: the outline, not filled
‘stepfilled’: outline, filled
align: ‘mid’, ‘left’, ‘right’
orientation: ‘horizontal’, ‘vertical’
rwidth: rectangle width
color: can be a array
stacked: whether to stack up multiple input (x), (overlapped with
‘barstacked’ type)
n: list, every bin’s value
bins: number of bins
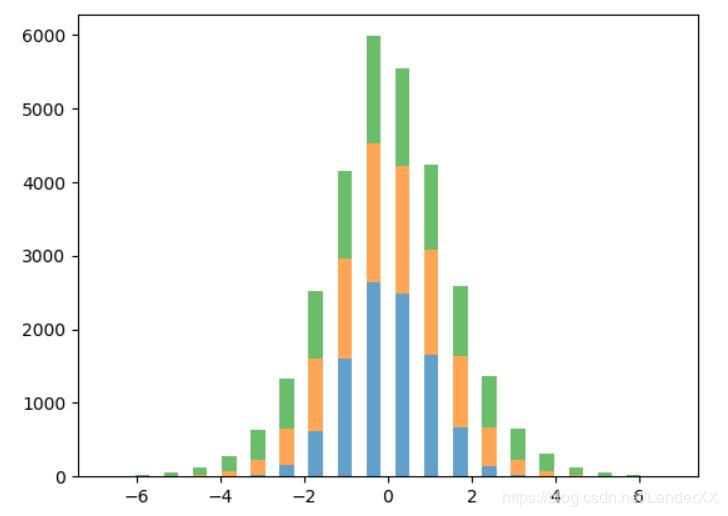
instancex = np.random.randn(10000)
plt.hist([x, x * 1.5, x * 2], bins = 20, histtype = 'barstacked',
alpha = 0.7, rwidth = 0.5)
plt.show()
method pie()
pie(x, explode = None, labels = None,
    colors = {'b', 'g', 'r', 'c', 'm' ,'y', 'k','w'},
    autopct = None, pctdistance = 0.6, shadow = False,
    labeldistance = 1.1, startangle = None, radius = None,
    counterclock = True, wedgeprops = None, textprops = None,
    center = (0, 0), frame = False, hold = None, data = None)
explode: array, split the pie XD
colors: color sequence
labels: string sequence
autopct: format string or format function,
to demonstrate the number of each wedge, formatstring % number
pctdistance: how far is the autopct, relevant dist
labeldistance: relevant dist
frame: whether to show axes
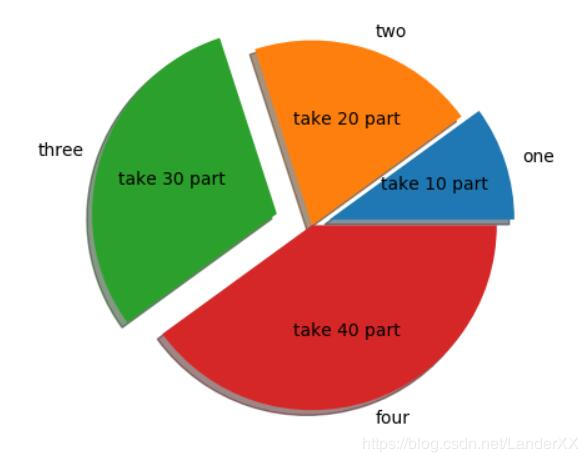
instancex = [1, 2, 3, 4]
labels = ['one', 'two', 'three', 'four']
explode = [0.1, 0, 0.2, 0]
plt.pie(x, labels = labels, explode = explode,
autopct = 'take %.1d part',
shadow = True)
plt.show()
method bar()
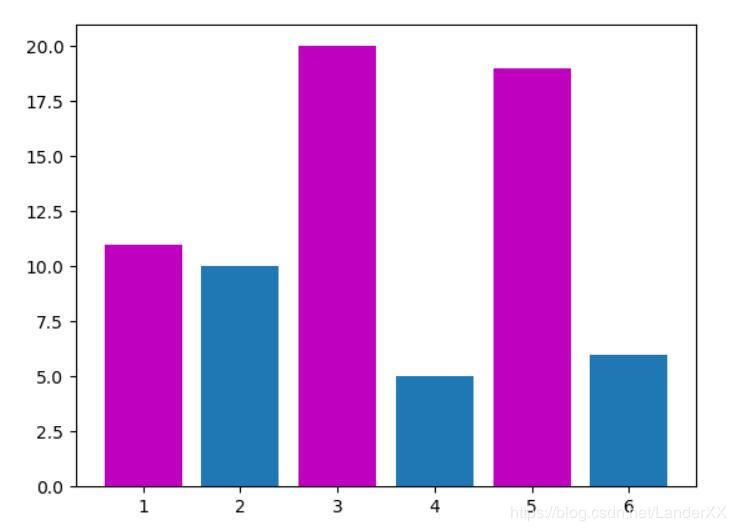
instancex1 = [1, 3, 5]
y1 = [11, 20, 19]
x2 = [2, 4, 6]
y2 = [10, 5, 6]
plt.bar(x1, y1, color = 'm')
plt.bar(x2, y2, align = 'center')
plt.show()
bar-graph is almost the same to the simple line graph,
though discrete.
histogram is for frequency statistics.
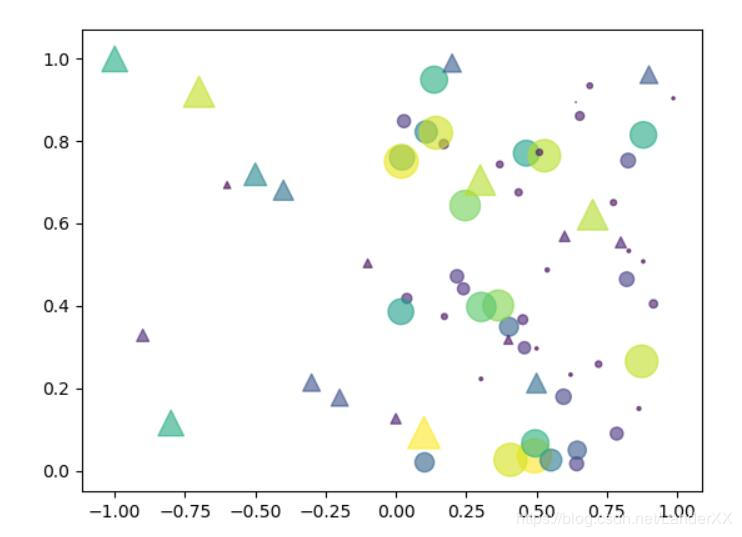
scattermethod scatter
parameterss: scalar or array --each point’s size
c: color, sequence, or color sequence
instancex = np.random.rand(50)
y = np.random.rand(50)
x2 = np.arange(-1, 1, 0.1)
y2 = np.random.rand(20)
s = (20 * np.random.rand(50)) ** 2
c = s
s2 = (20 * np.random.rand(20)) ** 2
c2 = s2
plt.scatter(x, y, s = s, c = c, alpha = 0.6)
plt.scatter(x2, y2, s = s2, c = c2, alpha = 0.6, marker = '^')
plt.show()
three parameters
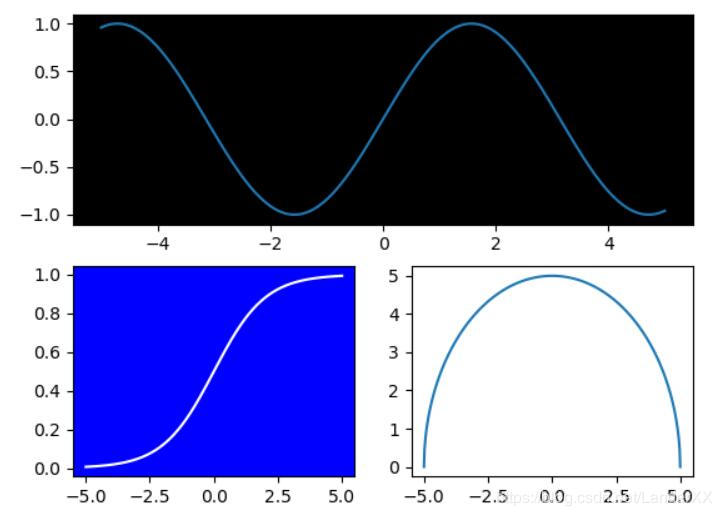
instance1 below --basic operation
p1 = plt.subplot(2, 1, 1, facecolor = 'k')
# when less than 10, can use subplot(211)
p2 = plt.subplot(223, facecolor = 'b')
p3 = plt.subplot(224)
# when counting smaller plots, imagine to split previous bigger ones
p1.plot(x, y1)
p2.plot(x, y2, 'w')
p3.plot(x, y3)
plt.show()
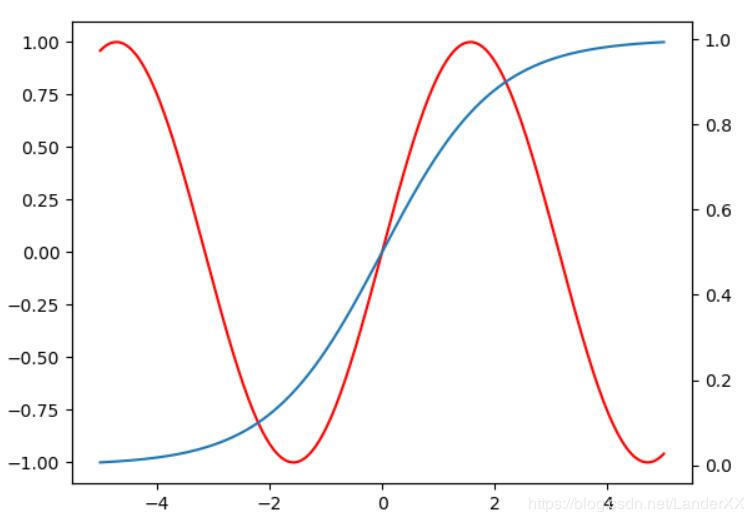
instance2 below –twinx(), twiny()
p1 = plt.subplot(111)
p2 = p1.twinx()
p1.plot(x, y1, 'r')
p2.plot(x, y2, 'r')
plt.show()
f, (p1, p2, ) = \
plt.subplots(nrows = 1, ncols = 1,
             sharex = False, sharey = False,
             squeeze = True,
             subplot_kw = None,
             **fig_kw)
nrows, ncols:
the row/col number for the subplot matrix
sharex, sharey:True, False
or ‘all’ or 'none’
(same to True or False)
or ‘row’ or 'col’
(when all subplot on same row/col share x/y axis)
bool, when returning, whether to squeeze the dimension
returnfigure and a tuple containing each plot
instancef, (p1, p2) = plt.subplots(1, 2, sharey = 'row')
p1.plot(x, y1)
p2.scatter(x, y2)
plt.show()
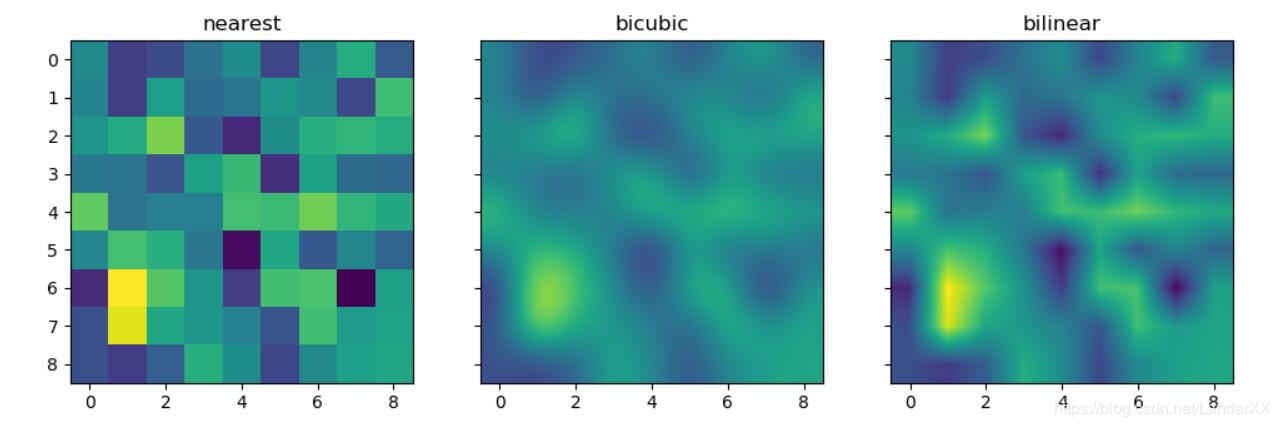
image
x = np.random.randn(81).reshape([9, 9])
f, p = plt.subplots(ncols = 3, sharey = True, figsize = [12, 4])
p[0].imshow(x, interpolation = 'nearest')
p[0].set_title('nearest')
p[1].imshow(x, interpolation = 'bicubic')
p[1].set_title('bicubic')
p[2].imshow(x, interpolation = 'bilinear')
p[2].set_title('bilinear')
plt.show()
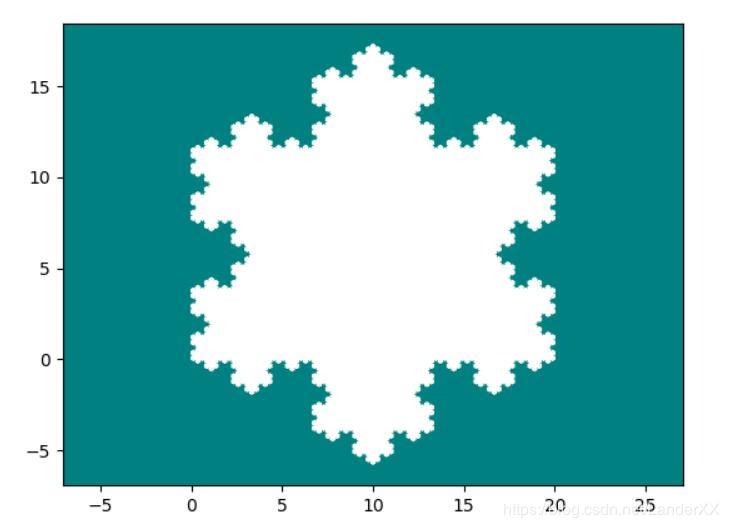
snowflake instance
import numpy as np
import matplotlib.pyplot as plt
n = 0
x_list = []
y_list = []
mat = np.array([[1 / 2, -1 / (2 * 3 ** 0.5)],
                [1 / (2 * 3 ** 0.5), 1 / 2]])
# turn a 30-degree angle
def koch_snowflake(cur, p1, p2):
    global n
    if cur > n: return
    p1 = np.array(p1)
    p2 = np.array(p2)
    x_list.append(p1[0])
    y_list.append(p1[1])
    p3 = p1 + (p2 - p1) / 3
    koch_snowflake(cur + 1, p1, p3)
    x_list.append(p3[0])
    y_list.append(p3[1])
    p4 = p1 + np.matmul(mat, (p2 - p1))
    koch_snowflake(cur + 1, p3, p4)
    x_list.append(p4[0])
    y_list.append(p4[1])
    p5 = p2 - (p2 - p1) / 3
    koch_snowflake(cur + 1, p4, p5)
    x_list.append(p5[0])
    y_list.append(p5[1])
    koch_snowflake(cur + 1, p5, p2)
    x_list.append(p2[0])
    y_list.append(p2[1])
def main():
    global n
    n = int(input('please input the recursion depth: '))
    koch_snowflake(1, (0, 0), (10, 10 * 3 ** 0.5))
    koch_snowflake(1, (10, 10 * 3 ** 0.5), (20, 0))
    koch_snowflake(1, (20, 0), (0, 0))
    p1 = plt.subplot(111, facecolor = 'teal')
    plt.axis('equal')
    p1.fill(x_list, y_list, color = 'w')
    plt.show()
if __name__ == '__main__':
    main()
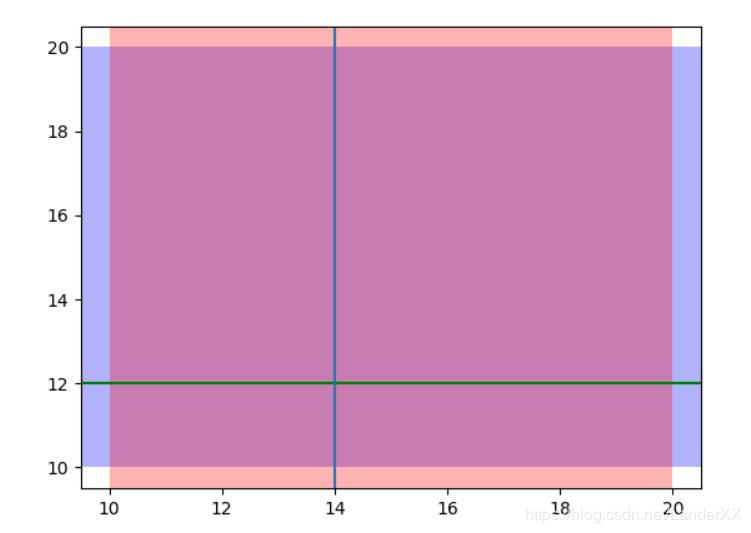
plt.axhspan(10, 20, facecolor = 'b', alpha = 0.3)
plt.axvspan(10, 20, facecolor = 'r', alpha = 0.3)
plt.axhline(y = 12, color = 'g', xmax = 20)
plt.axvline(x = 14, ymin = 0)
plt.show()

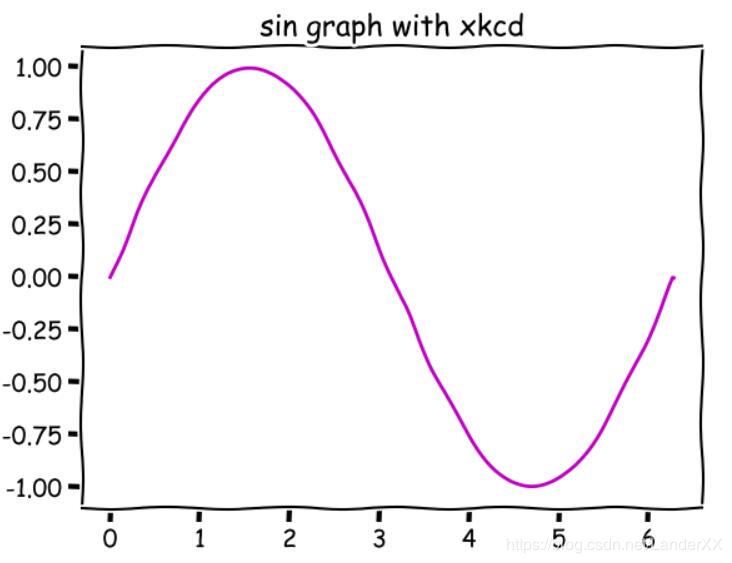
everything old, but with plt.xkcd():
x = np.arange(0, pi * 2, 0.005)
y = [sin(xx) for xx in x]
with plt.xkcd():
    plt.plot(x, y, 'm')
    plt.title('sin graph with xkcd')
    plt.show()
作者:LanderXX