假期作业三:读入一个RGB文件,输出该数据文件中RGB三分量的概率分布示意图和熵。
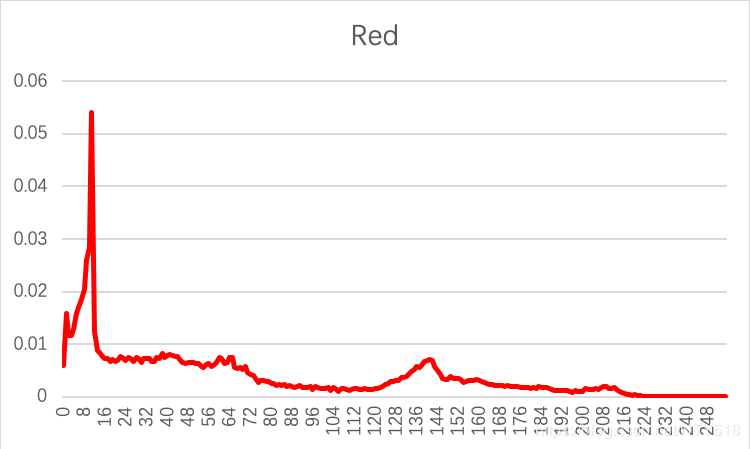
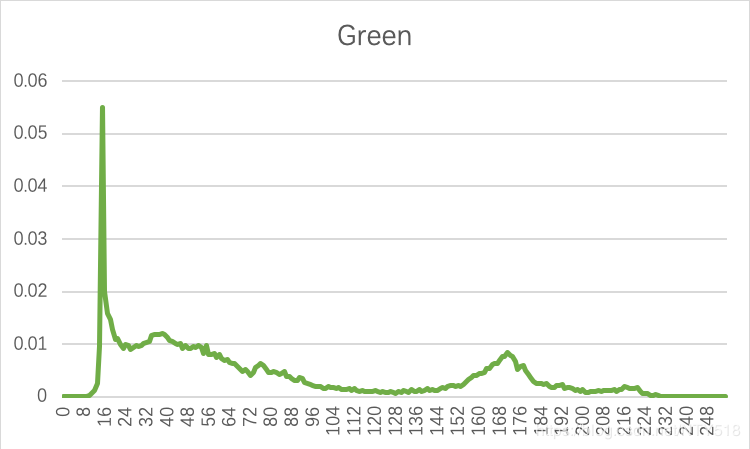
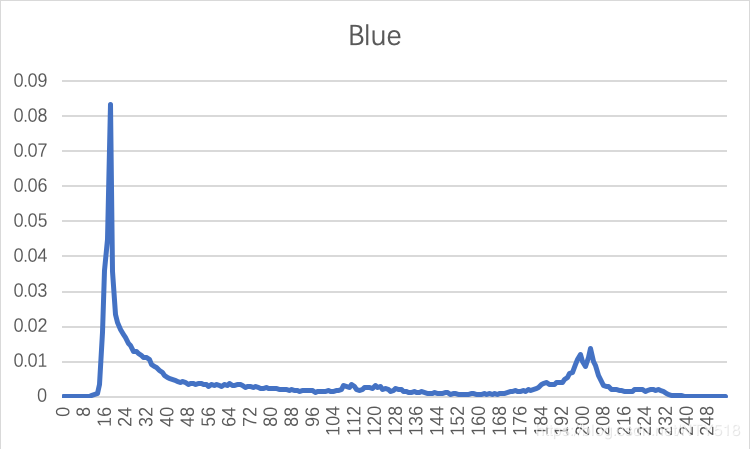
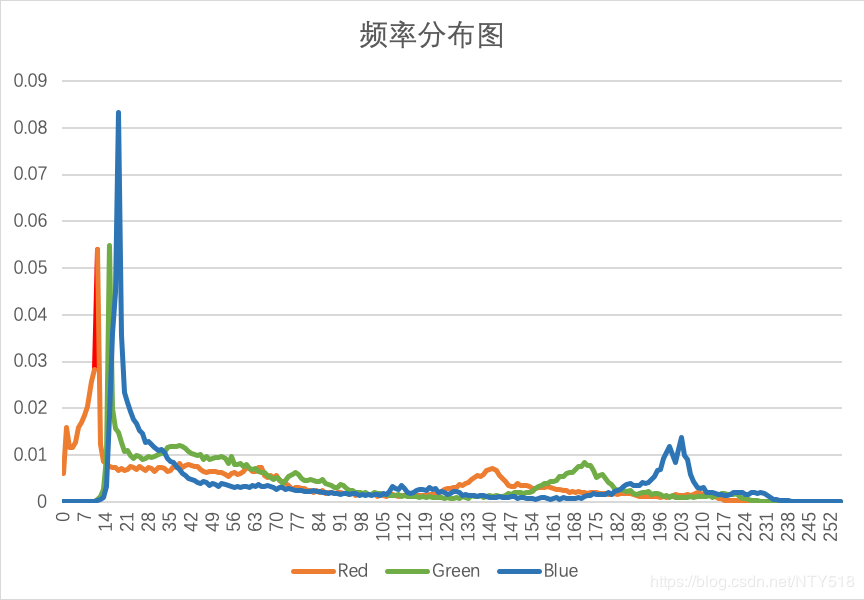
作业内容:读入一个24bitRGB文件(以down.rgb为例,其分辨率为256256),输出该数据文件中R、G、B三个分量(各8bit表示)的概率分布示意图(类似下图)和熵。
提示:(用C或C++实现时),程序的流程为
开辟3个widthheight的unsigned char型数组;打开要读出的RGB文件(以“rb”方式打开),打开3个要输出的数据统计文件(以“w”方式打开,可命名为R_sat.txt等);将RGB数据从RGB文件中读出,并分别保存到3个数组中,期间计算数据的概率分布和熵,并将这些数据写入3个数据统计txt文件中。Txt文件的写入方式如下所示(每行的两个数据用tab分开)。在Excel里将这3个txt文件打开即可生成统计图。
具体思路:
1.首先使用fopen函数打开rgb文件并创建空的txt文件
2.通过fseek函数,先找到文件的末尾,再通过ftell函数计算出文件中数据的总大小(其实这里实现已知文件是分辨率为256256的RGB文件,故文件中共有2562563个十六进制数,但为了保证代码普适性还是采用fseek和ftell的方式)
3.将RGB文件中的数据先都全部读入一个大数组中,这个大数组的长度就是2562563,而由于RGB文件中的排列是B,G,R,B,G,R…所以我们便可以用循环的方法来得出存储R,G,B相应数据的长度为256256的数组。
4.得出了这样的数组,就可以分别计算其概率分布和信息熵了
5.最后,利用fprintf输出RGB的概率分布到事先已经建立好的三个txt文件中
C++代码实现:
#include
#include
using namespace std;
constexpr auto width = 256;
constexpr auto height = 256;
int main()
{
	FILE* Image;
	FILE* Red;
	FILE* Green;
	FILE* Blue;
	fopen_s(&Image, "down.rgb", "rb");//Read in the file "down.rgb"
	fopen_s(&Red, "Red.txt", "w");//Get 3 txt files which will reserve the contants of down.rgb
	fopen_s(&Green, "Green.txt", "w");
	fopen_s(&Blue, "Blue.txt", "w");
	fseek(Image, 0L, SEEK_END);
	int size;
	size = ftell(Image);
	fseek(Image, 0L, SEEK_SET);//caculate the length of the file"down.rgb"
	unsigned char* Image_Buffer = new unsigned char[size];
	fread(Image_Buffer, sizeof(unsigned char), size, Image);//read in to the buffer
	unsigned char* Red_Buffer = new unsigned char[size / 3];
	unsigned char* Green_Buffer = new unsigned char[size / 3];
	unsigned char* Blue_Buffer = new unsigned char[size / 3];
	for (int i = 0; i < size / 3; i++)//seperate these datas into red green and blue buffers
	{
		Red_Buffer[i] = Image_Buffer[3 * i+2];
	}
	for (int i = 0; i < size / 3; i++)
	{
		Green_Buffer[i] = Image_Buffer[3 * i+1];
	}
	for (int i = 0; i < size / 3; i++)
	{
		Blue_Buffer[i] = Image_Buffer[3 * i];
	}
	//Start caculating frequency and information entropy of each color:(As each point of the image is decide by three dimensions of colors)
	//And each color is defined by a Hex number in length2, which means the biggest number in the array is 255
	int Caculate_Red[256] = { 0 };
	double Frequency_Red[256] = { 0 };
	double Entropy_Red = 0;
	int Caculate_Green[256] = { 0 };
	double Frequency_Green[256] = { 0 };
	double Entropy_Green = 0;
	int Caculate_Blue[256] = { 0 };
	double Frequency_Blue[256] = { 0 };
	double Entropy_Blue= 0;
	for (int i = 0; i < 256; i++)
	{
		for (int j = 0; j < width * height; j++)
		{
			if (i == Red_Buffer[j])
			{
				Caculate_Red[i]++;
			}
		}
	}
	for (int i = 0; i < 256; i++)
	{
		for (int j = 0; j < width * height; j++)
		{
			if (i == Green_Buffer[j])
			{
				Caculate_Green[i]++;
			}
		}
	}
	for (int i = 0; i < 256; i++)
	{
		for (int j = 0; j < width * height; j++)
		{
			if (i == Blue_Buffer[j])
			{
				Caculate_Blue[i]++;
			}
		}
	}
	for (int i = 0; i < 256; i++)
	{
		Frequency_Red[i] = (double)Caculate_Red[i] / (width * height);
		//be caution of the qiang zhi lei xing transformation or there will be bugs
	}
	for (int i = 0; i < 256; i++)
	{
		Frequency_Green[i] = (double)Caculate_Green[i] / (width * height);
	}
	for (int i = 0; i < 256; i++)
	{
		Frequency_Blue[i] = (double)Caculate_Blue[i] / (width * height);
	}
	for (int i = 0; i < 256; i++)
	{
		if (Frequency_Red[i] != 0)
		{
			Entropy_Red += (-1) * Frequency_Red[i] * (log(Frequency_Red[i]) / log(2));
			//caculate the information entropy
		}
	}
	cout << "The information entropy of color Red is " << Entropy_Red << endl;
	for (int i = 0; i < 256; i++)
	{
		if (Frequency_Green[i] != 0)
		{
			Entropy_Green += (-1) * Frequency_Green[i] * (log(Frequency_Green[i]) / log(2));
		}
	}
	cout << "The information entropy of color Green is " << Entropy_Green << endl;
	for (int i = 0; i < 256; i++)
	{
		if (Frequency_Blue[i] != 0)
		{
			Entropy_Blue += (-1) * Frequency_Blue[i] * (log(Frequency_Blue[i]) / log(2));
		}
	}
	cout << "The information entropy of color Blue is " << Entropy_Blue<< endl;
	fprintf(Red, "symbol\tfreq\n");//put out the chart
	for(int i=0;i<256;i++)
	{
		fprintf(Red, "%d\t%f\n",i,Frequency_Red[i]);
	}
	fprintf(Green, "symbol\tfreq\n");
	for (int i = 0; i < 256; i++)
	{
		fprintf(Green, "%d\t%f\n", i, Frequency_Green[i]);
	}
	fprintf(Blue, "symbol\tfreq\n");
	for (int i = 0; i < 256; i++)
	{
		fprintf(Blue, "%d\t%f\n", i, Frequency_Blue[i]);
	}
	fclose(Image);
	fclose(Red);
	fclose(Green);
	fclose(Blue);
}
程序运行结果1:(输出为RGB三个分量各自的信息熵)

程序运行结果2:(在文件夹中生成了3个命名分别为Red,Green和Blue的txt文件)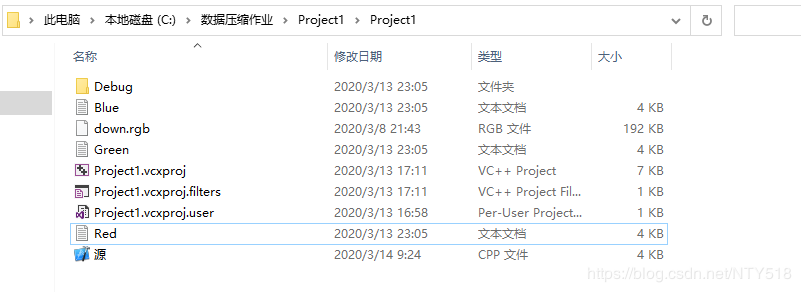
程序运行结果3:(输出的三个记事本文件中的部分内容)


用excel打开三个txt文件后绘图:
作者:NTY518