echarts中几种渐变方式的具体实现方式
在echarts 中实现渐变的具体几种方式
方式一:
方式二:colorStops
总结
在echarts 中实现渐变的具体几种方式在我们日常使用Echarts图表过程中,会遇到一些要求我们的echarts图表能实现颜色渐变,以下几种方式就能满足你的需求。文档参考 ECharts option 文档 。
方式一:线性渐变:new echarts.graphic.LinearGradient(x,y,x2,y2,offset,boolean)
x,y,x2,y2,包围框中的百分比,数值范围 0-1;
offset,类似颜色线性梯度,数值范围 0-1;
boolean,默认false,若最后参数为true,前四个参数将使用像素位置。
径向渐变:new echarts.graphic.RadialGradient(x,y,r,offset,boolean)
x,y,代表圆心,数值范围 0-1;
r,代表半径,数值范围 0-1;
offset,类似颜色线性梯度,数值范围 0-1;
boolean,默认false,若最后参数为true,前四个参数将使用像素位置。
采用图片显示:new echarts.graphic.Pattern(imageDom,repeat)
imageDom,仅支持 HTMLImageElement 和 HTMLCanvasElement形式图片;
repeat,默认’repeat’,可取值还有’repeat-x’, ‘repeat-y’, or ‘no-repeat’;
代码示例:
// 创建 HTMLImageElement
// HTMLCanvasElement请自行研究去
var imageDom = new Image(); // Image 构造函数
imageDom.src = '/static/img/map_bg.png'; // 图片路径
imageDom.alt = '这是一张图片';
// 应用如下
// color:{
//   image: imageDom, // 支持为 HTMLImageElement, HTMLCanvasElement,不支持路径字符串
//    repeat: 'repeat' // 是否平铺,可以是 'repeat-x', 'repeat-y', 'no-repeat'
// }
方式二:colorStops
线性渐变:colorStops - linear
type:‘linear’,线性渐变
x,y,x2,y2,代表包围框中的百分比,数值范围 0-1;
colorStops,类似颜色线性梯度,数值范围 0-1;
global,默认false
径向渐变:colorStops - radial
type:‘radial’,径向渐变
x,y,代表圆心,数值范围 0-1;
r,代表半径,数值范围 0-1;
colorStops,类似颜色线性梯度,数值范围 0-1;
global,默认false
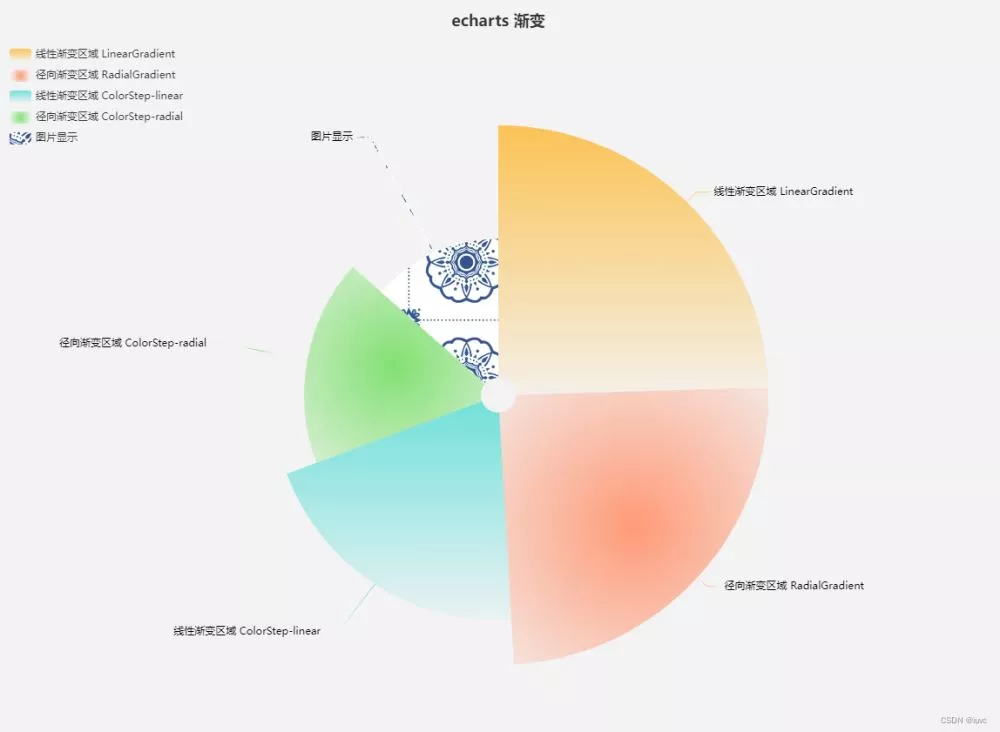
效果图:
代码如下:
var imageDom = new Image(); // Image 构造函数
imageDom.src = 'https://github.com/iuvc/magicJs/blob/main/public/images/issues/blue-white-background.jpg?raw=true';
imageDom.alt = '测试';
option = {
  title: {
    text: 'echarts 渐变',
    left: 'center'
  },
  tooltip: {
    trigger: 'item',
    formatter: '{a} <br/>{b} : {c} ({d}%)'
  },
  legend: {
    top: 40,
    left: 0,
    orient: 'vertical',
    data: [
      '线性渐变区域 LinearGradient',
      '径向渐变区域 RadialGradient',
      '线性渐变区域 ColorStep-linear',
      '径向渐变区域 ColorStep-radial',
      '图片显示'
    ]
  },
  series: [
    {
      name: 'Radius Mode',
      type: 'pie',
      radius: [20, '70%'],
      center: ['50%', '50%'],
      roseType: 'radius',
      itemStyle: {
        borderRadius: 5
      },
      label: {
        show: true
      },
      emphasis: {
        label: {
          show: true
        }
      },
      data: [
        {
          value: 40,
          name: '线性渐变区域 LinearGradient',
          itemStyle: {
            //  线性渐变方式一 ======================================================
            // LinearGradient前四个分参数别代表右,下,左,上,数值0-1
            color: new echarts.graphic.LinearGradient(0, 0, 0, 1, [
              {
                offset: 0,
                color: 'rgba(255,174,19,0.7)'
              },
              {
                offset: 1,
                color: 'rgba(255,174,19,0.05)'
              }
            ])
          }
        },
        {
          value: 40,
          name: '径向渐变区域 RadialGradient',
          itemStyle: {
            //  径向渐变方式一 ======================================================
            // RadialGradient前三个分参数别代表圆心(x,y),半径(数值0-1)
            color: new echarts.graphic.RadialGradient(0.5, 0.5, 0.8, [
              {
                offset: 0,
                color: 'rgba(255,154,119,1)'
              },
              {
                offset: 1,
                color: 'rgba(255,154,119,0.05)'
              }
            ])
          }
        },
        {
          value: 33,
          name: '线性渐变区域 ColorStep-linear',
          itemStyle: {
            //  线性渐变方式二 ======================================================
            // x,y,x2,y2数值同LinearGradient前四个参数分别代表右,下,左,上,数值0-1
            color: {
              type: 'linear',
              x: 0,
              y: 0,
              x2: 0,
              y2: 1,
              colorStops: [
                {
                  offset: 0,
                  color: 'rgba(60,216,208,0.7)' // 0% 处的颜色
                },
                {
                  offset: 1,
                  color: 'rgba(60,216,208,0.05)' // 100% 处的颜色
                }
              ],
              global: false // 缺省为 false
            }
          }
        },
        {
          value: 28,
          name: '径向渐变区域 ColorStep-radial',
          itemStyle: {
            //  径向渐变方式二 ======================================================
            // x 0.5 y 0.5 代表圆心,r 代表半径
            color: {
              type: 'radial',
              x: 0.5,
              y: 0.5,
              r: 0.9,
              colorStops: [
                {
                  offset: 0,
                  color: 'rgba(82,216,60, 0.7)' // 0% 处的颜色
                },
                {
                  offset: 1,
                  color: 'rgba(82,216,60, 0.05)' // 100% 处的颜色
                }
              ],
              global: false // 缺省为 false
            }
          }
        },
        {
            value: 22,
            name: '图片显示' ,
            itemStyle: {
            //  图片显示 ======================================================
                color: {
                  image: imageDom, // 支持为 HTMLImageElement, HTMLCanvasElement,不支持路径字符串
                  repeat: 'repeat' // 是否平铺,可以是 'repeat-x', 'repeat-y', 'no-repeat'
                }
            }
        }
      ]
    }
  ]
};
其他示例:

代码如下:
option = {
  title: {
    text: '渐变区域图'
  },
  tooltip: {
    trigger: 'axis',
    axisPointer: {
      type: 'cross',
      label: {
        backgroundColor: '#6a7985'
      }
    }
  },
  legend: {
    top: 15,
    data: [
      '线性渐变区域 LinearGradient',
      '线性渐变区域 ColorStep-linear',
      '径向渐变区域 ColorStep-radial',
      '径向渐变区域 RadialGradient'
    ]
  },
  grid: {
    top: 55,
    left: 45,
    right: 15,
    bottom: 25
  },
  xAxis: [
    {
      type: 'category',
      boundaryGap: true,
      axisLine: {
        show: false,
        onZero: true,
        lineStyle: {
          color: '#999999'
        }
      },
      splitLine: {
        show: false
      },
      axisTick: {
        show: false
      },
      data: [
        '00:00',
        '00:15',
        '00:30',
        '00:45',
        '01:00',
        '01:15',
        '01:30',
        '01:45',
        '02:00',
        '02:15',
        '02:30',
        '02:45',
        '03:00',
        '03:15',
        '03:30',
        '03:45',
        '04:00',
        '04:15',
        '04:30',
        '04:45',
        '05:00',
        '05:15',
        '05:30',
        '05:45',
        '06:00',
        '06:15',
        '06:30',
        '06:45',
        '07:00',
        '07:15',
        '07:30',
        '07:45',
        '08:00',
        '08:15',
        '08:30',
        '08:45',
        '09:00',
        '09:15',
        '09:30',
        '09:45',
        '10:00',
        '10:15',
        '10:30',
        '10:45',
        '11:00',
        '11:15'
      ]
    }
  ],
  yAxis: [
    {
      type: 'category',
      boundaryGap: true,
      axisLine: {
        show: false,
        onZero: true,
        lineStyle: {
          color: '#999999'
        }
      },
      splitLine: {
        show: false
      },
      axisTick: {
        show: false
      }
    }
  ],
  series: [
    {
      name: '线性渐变区域 LinearGradient',
      type: 'line',
      stack: '总量',
      data: [
        1.67, 1.25, 1.02, 1.44, 1.81, 1.13, 1.58, 1.13, 1.56, 1.3, 1.9, 1.3,
        1.55, 1.94, 1.69, 1.69, 1.8, 1.21, 1.29, 1.58, 1.04, 1.67, 1.07, 1.18,
        1.57, 1.05, 1.63, 1.28, 1.28, 1.58, 1.88, 1.2, 1.63, 1.59, 1.43, 1.25,
        1.68, 1.25, 1.12, 1.31, 1.6, 1.62, 1.57, 1.2, 1.02, 1.42, 1.91, 1.97,
        1.32, 1.06, 1.3, 1.22, 1.74, 1.02, 1.75, 1.2
      ],
      areaStyle: {
        color: new echarts.graphic.LinearGradient(0, 0, 0, 1, [
          {
            offset: 0,
            color: 'rgba(255,174,19,0.7)'
          },
          {
            offset: 1,
            color: 'rgba(255,174,19,0.05)'
          }
        ])
      },
      itemStyle: {
        color: 'rgba(255,174,19,.1)'
      },
      lineStyle: {
        color: 'rgba(255,174,19,.1)'
      },
      smooth: true,
      smoothMonotone: 'x',
      symbol: 'circle'
    },
    {
      name: '线性渐变区域 ColorStep-linear',
      type: 'line',
      stack: '总量',
      data: [
        2.31, 2.27, 1.64, 1.56, 1.75, 1.62, 2.18, 2.12, 1.97, 2.45, 2.39, 2.3,
        1.78, 1.82, 1.82, 1.76, 1.78, 1.63, 1.54, 1.6, 1.61, 1.68, 1.67, 1.67,
        2.34, 1.69, 2.18, 2.25, 2.44, 2.4, 1.97, 2.05, 2.05, 2.46, 1.62, 1.66,
        1.66, 1.87, 1.59, 1.99, 2.45, 2.05, 1.53, 2.39, 1.77, 1.99, 2.14, 2.33,
        1.55, 1.87, 1.65, 2.02, 1.68, 2.13, 1.88, 2.19
      ],
      areaStyle: {
        color: {
          type: 'linear',
          x: 0,
          y: 0,
          x2: 0,
          y2: 1,
          colorStops: [
            {
              offset: 0,
              color: 'rgba(60,216,208,0.7)' // 0% 处的颜色
            },
            {
              offset: 1,
              color: 'rgba(60,216,208,0.05)' // 100% 处的颜色
            }
          ],
          global: false // 缺省为 false
        }
      },
      itemStyle: {
        color: 'rgba(60,216,208,.1)'
      },
      lineStyle: {
        color: 'rgba(60,216,208,.1)'
      },
      smooth: true,
      smoothMonotone: 'x',
      symbol: 'circle'
    },
    {
      name: '径向渐变区域 RadialGradient',
      type: 'line',
      stack: '总量',
      label: {
        normal: {
          show: true,
          position: 'top'
        }
      },
      data: [
        2.69, 2.47, 2.53, 3.31, 3.25, 3.12, 2.66, 2.58, 3.01, 3.21, 2.69, 2.72,
        2.67, 3.34, 3.21, 2.79, 3.23, 3.07, 2.84, 2.46, 3.25, 2.92, 2.42, 2.61,
        2.83, 3.29, 2.44, 3.38, 2.82, 2.56, 2.94, 2.42, 2.95, 2.82, 3.18, 2.6,
        2.91, 3.07, 2.57, 2.45, 2.45, 2.94, 2.86, 3.12, 3.07, 3.02, 2.53, 2.64,
        2.97, 2.62, 2.79, 2.68, 3.24, 3.38, 2.67, 3.17
      ],
      areaStyle: {
        color: new echarts.graphic.RadialGradient(0.5, 0.5, 0.8, [
          {
            offset: 0,
            color: 'rgba(255,154,119,.7)'
          },
          {
            offset: 1,
            color: 'rgba(255,154,119,0.05)'
          }
        ])
      },
      itemStyle: {
        color: 'rgba(255,154,119,.1)'
      },
      lineStyle: {
        color: 'rgba(255,154,119,.1)'
      },
      smooth: true,
      smoothMonotone: 'x',
      symbol: 'circle'
    },
    {
      name: '径向渐变区域 ColorStep-radial',
      type: 'line',
      stack: '总量',
      label: {
        normal: {
          show: true,
          position: 'top'
        }
      },
      data: [
        2.79, 2.57, 2.63, 3.41, 3.35, 3.22, 2.76, 2.68, 3.11, 3.31, 2.79, 2.82,
        2.77, 3.44, 3.31, 2.89, 3.33, 3.17, 2.94, 2.56, 3.35, 3.02, 2.52, 2.71,
        2.93, 3.39, 2.54, 3.48, 2.92, 2.66, 3.04, 2.52, 3.05, 2.92, 3.28, 2.7,
        3.01, 3.17, 2.67, 2.55, 2.55, 3.04, 2.96, 3.22, 3.17, 3.12, 2.63, 2.74,
        3.07, 2.72, 2.89, 2.78, 3.34, 3.48, 2.77, 3.27
      ],
      areaStyle: {
        color: {
          type: 'radial',
          x: 0.5,
          y: 0.5,
          r: 0.9,
          colorStops: [
            {
              offset: 0,
              color: 'rgba(82,216,60, 0.7)' // 0% 处的颜色
            },
            {
              offset: 1,
              color: 'rgba(82,216,60, 0.05)' // 100% 处的颜色
            }
          ],
          global: false // 缺省为 false
        }
      },
      itemStyle: {
        color: 'rgba(82,216,60,.1)'
      },
      lineStyle: {
        color: 'rgba(82,216,60,.1)'
      },
      smooth: true,
      smoothMonotone: 'x',
      symbol: 'circle'
    }
  ]
};
总结
到此这篇关于echarts中几种渐变方式的具体实现的文章就介绍到这了,更多相关echarts渐变方式实现内容请搜索软件开发网以前的文章或继续浏览下面的相关文章希望大家以后多多支持软件开发网!