python matplotlib画图时坐标轴重叠显示不全和图片保存时不完整的问题解决
目录
问题
解决方案
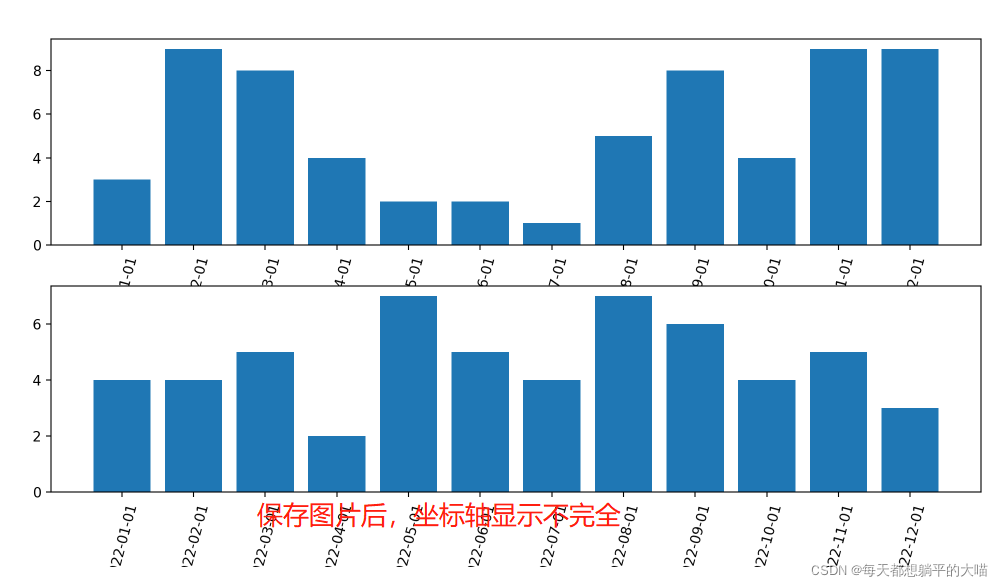
保存时图片不完整的问题
补充:使用matplotlib时如何让坐标轴完整显示所有的标签刻度
总结
问题在使用matplotlib作图的时候,有的时候会遇到画图时坐标轴重叠,显示不全和图片保存时不完整的问题。如下:
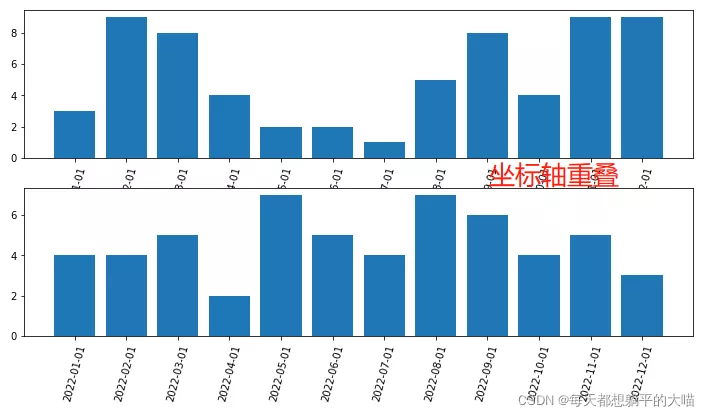
画图时重叠或者显示不全的问题
画图时加上参数设置tight_layout=True
画完所有子图后,设置plt.tight_layout()
# 加上tight_layout=True 参数设置
fig, axes = plt.subplots(nrows=2, ncols=1, figsize=(12,6), tight_layout=True)
labels = ['2022-{}-01'.format(str(i).zfill(2)) for i in range(1,13)]
y1 = np.random.randint(low=1, high=10, size=12)
y2 = np.random.randint(low=1, high=10, size=12)
axes[0].bar(labels, y1)
axes[0].set_xticks(labels)
axes[0].set_xticklabels(labels, rotation=75)
axes[1].bar(labels, y2)
axes[1].set_xticks(labels)
axes[1].set_xticklabels(labels, rotation=75)
plt.savefig('test.png', dpi=200)
fig, axes = plt.subplots(nrows=2, ncols=1, figsize=(12,6))
labels = ['2022-{}-01'.format(str(i).zfill(2)) for i in range(1,13)]
y1 = np.random.randint(low=1, high=10, size=12)
y2 = np.random.randint(low=1, high=10, size=12)
axes[0].bar(labels, y1)
axes[0].set_xticks(labels)
axes[0].set_xticklabels(labels, rotation=75)
axes[1].bar(labels, y2)
axes[1].set_xticks(labels)
axes[1].set_xticklabels(labels, rotation=75)
plt.tight_layout()
# 这里加上plt.tight_layout(),记住要在画完所有子图后
plt.savefig('test.png', dpi=200)
效果如下:
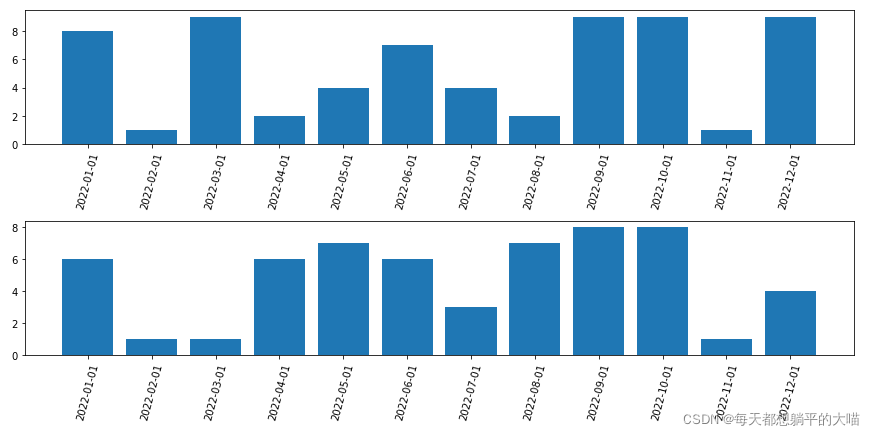
在plt.savefig中加入bbox_inches='tight’参数设置
fig, axes = plt.subplots(nrows=2, ncols=1, figsize=(12,6), tight_layout=True)
labels = ['2022-{}-01'.format(str(i).zfill(2)) for i in range(1,13)]
y1 = np.random.randint(low=1, high=10, size=12)
y2 = np.random.randint(low=1, high=10, size=12)
axes[0].bar(labels, y1)
axes[0].set_xticks(labels)
axes[0].set_xticklabels(labels, rotation=75)
axes[1].bar(labels, y2)
axes[1].set_xticks(labels)
axes[1].set_xticklabels(labels, rotation=75)
plt.savefig('test.png', dpi=600, bbox_inches='tight')
# savefig时加入bbox_inches='tight'参数设置
补充:使用matplotlib时如何让坐标轴完整显示所有的标签刻度
在使用matplotlib时,由于数据量过大,在默认设置下,使用plot等时,会将x,y轴的刻度按一定比例缩减掉一部分,如:1,2,3,4,5,6,7,8,9,10会显示成2,4,6,8,10等,解决方法是使用xticks()和yticks():
xticks(ticks=None, labels=None, **kwargs)
ticks:x轴显示的数值(类型:list),若为空,则x轴上不会显示任何数值;
labels:标签项,当ticks不为空时,labels内容将覆盖ticks的内容
**kwargs:控制标签内容的排版
Return:
locs:返回x轴坐标列表
labels:返回x轴标签列表
总结到此这篇关于python matplotlib画图时坐标轴重叠显示不全和图片保存时不完整问题解决的文章就介绍到这了,更多相关matplotlib画图时坐标轴重叠显示不全内容请搜索软件开发网以前的文章或继续浏览下面的相关文章希望大家以后多多支持软件开发网!