Vue-cli3中如何引入ECharts并实现自适应
目录
如何引入ECharts并实现自适应
效果
Vue-cli使用ECharts并封装ECharts组件
1. 导入echarts
2. 封装echarts组件
3. 父组件引用测试
如何引入ECharts并实现自适应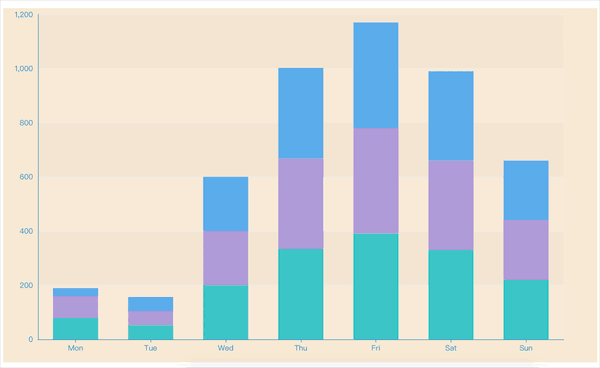
1. 安装echarts
npm install echarts
2. components/echarts/index.vue
<template>
  <div :class="className" :style="{height:height,width:width}" />
</template>
<script>
  import echarts from 'echarts'
  require('echarts/theme/macarons') // echarts theme
  import {debounce} from '@/utlis/index.js'
  const animationDuration = 6000
  export default {
    props: {
      className: {
        type: String,
        default: 'chart'
      },
      width: {
        type: String,
        default: '100%'
      },
      height: {
        type: String,
        default: '100%'
      },
      // 数据源
      echartsData: {
        type: Object,
        default: {}
      },
    },
    data() {
      return {
        chart: null,
      }
    },
    watch: {
    },
    //初始化
    mounted() {
      this.initChart()
      this.resizeHandler = debounce(() => {
        if (this.chart) {
          this.chart.resize()
        }
      }, 100)
      window.addEventListener('resize', this.resizeHandler)
    },
  //销毁
    beforeDestroy() {
      if (!this.chart) {
        return
      }
      window.removeEventListener('resize', this.resizeHandler)
      this.chart.dispose()
      this.chart = null
    },
    methods: {
      initChart() {
        this.chart = echarts.init(this.$el, 'macarons')
        this.chart.setOption(this.echartsData, animationDuration)
      }
    }
  }
</script>
3. utlis/index.js
export function debounce(func, wait, immediate) {
  let timeout, args, context, timestamp, result
  const later = function() {
    // 据上一次触发时间间隔
    const last = +new Date() - timestamp
    // 上次被包装函数被调用时间间隔last小于设定时间间隔wait
    if (last < wait && last > 0) {
      timeout = setTimeout(later, wait - last)
    } else {
      timeout = null
      // 如果设定为immediate===true,因为开始边界已经调用过了此处无需调用
      if (!immediate) {
        result = func.apply(context, args)
        if (!timeout) context = args = null
      }
    }
  }
  return function(...args) {
    context = this
    timestamp = +new Date()
    const callNow = immediate && !timeout
    // 如果延时不存在,重新设定延时
    if (!timeout) timeout = setTimeout(later, wait)
    if (callNow) {
      result = func.apply(context, args)
      context = args = null
    }
    return result
  }
}
4. 在.vue 中使用 test/index.vue
<template>
  <div id="test">
    <echarts :echartsData="echartsData" />
  </div>
</template>
<script>
  import echarts from '@/components/echarts/index'
  export default {
    components: {
      echarts
    },
    data() {
      return {
        echartsData: {
          tooltip: {
            trigger: 'axis',
            axisPointer: { // 坐标轴指示器,坐标轴触发有效
              type: 'shadow' // 默认为直线,可选为:'line' | 'shadow'
            }
          },
          grid: {
            top: 10,
            left: '2%',
            right: '2%',
            bottom: '3%',
            containLabel: true
          },
          xAxis: [{
            type: 'category',
            data: ['Mon', 'Tue', 'Wed', 'Thu', 'Fri', 'Sat', 'Sun'],
            axisTick: {
              alignWithLabel: true
            }
          }],
          yAxis: [{
            type: 'value',
            axisTick: {
              show: false
            }
          }],
          series: [{
            name: 'pageA',
            type: 'bar',
            stack: 'vistors',
            barWidth: '60%',
            data: [79, 52, 200, 334, 390, 330, 220],
          }, {
            name: 'pageB',
            type: 'bar',
            stack: 'vistors',
            barWidth: '60%',
            data: [80, 52, 200, 334, 390, 330, 220],
          }, {
            name: 'pageC',
            type: 'bar',
            stack: 'vistors',
            barWidth: '60%',
            data: [30, 52, 200, 334, 390, 330, 220],
          }]
        }
      }
    }
  }
</script>
<style lang="scss" scoped>
  #test {
    width: 100%;
    height: 100%;
    background: antiquewhite;
    position: absolute;
    top: 0px;
    bottom: 0px;
  }
</style>
Vue-cli使用ECharts并封装ECharts组件
1. 导入echarts
在终端输入
cnpm install echarts --save
在main.js中引入
import * as eCharts from 'echarts';
Vue.prototype.$eCharts = eCharts;
2. 封装echarts组件
新建组件echats.vue
首先应该明确Echarts图形必须满足四项刚性条件才可以绘制:
准备一个具有宽高的容器(container);
每次绘制之前需要初始化(init);
必须设置配置,否则无从绘制(option);
改变数据时必须传入改变的数据,否则监听不到新数据(setOption);
1.容器
注意,容器的宽高可以通过v-bind绑定样式的参数styleObj来设置(父组件引用时传递过来),使得应用echats组件时可以自由地设置宽高
<template>
  <div id="myChart" :style="styleObj" ref="chart">
  </div>
</template>
2.初始化+配置
由于初始化需要获取到容器dom,所以需要在mouted生命周期里面初始化
mounted () {
    //  因为需要拿到容器,所以要挂载之后
     this.init()
 },
 methods: {
     init(){
         let chart = this.$eCharts.init(this.$refs.chart)
         let option = {
          xAxis: {
            type: 'category',
            data: ['Mon', 'Tue', 'Wed', 'Thu', 'Fri', 'Sat', 'Sun'],
          }, //X轴
          yAxis: { type: 'value' }, //Y轴
          series: [
            {
              data: [120, 200, 150, 80, 70, 110, 130],
              type: 'bar',
            }] //配置项
         }
        chart.setOption(option)
 }
}
3. 父组件引用测试


以上为个人经验,希望能给大家一个参考,也希望大家多多支持软件开发网。
相关文章
Ada
2020-04-07
Doris
2021-04-19
Clementine
2020-12-26
Claire
2021-05-21
Rabia
2023-07-20
Brigitte
2023-07-20
Abbie
2023-07-20
Yvonne
2023-07-20
Rasine
2023-07-20
Tina
2023-07-20
Kande
2023-07-20
Netany
2023-07-20
Flower
2023-07-20
Heather
2023-07-20
Tertia
2023-07-20
Fredrica
2023-07-20
Katherine
2023-07-20
Genet
2023-07-20