如何用plt绘制模型准确率
可从tensorflow官方教程中看到。
(https://tensorflow.google.cn/tutorials/images/classification?hl=zh_cn)
在使用keras 进行训练 的时候
model.fit会返回一个history
即:定义:history=model.fit()
model中含有acc val_acc loss val_loss 数据,然后调用plt即可完成绘制
history=model.fit(dataset,epochs=5,callbacks=[tensorboard_callbacks])
import matplotlib.pyplot as plt
acc = history.history['accuracy']
val_acc = history.history['val_accuracy']
loss=history.history['loss']
val_loss=history.history['val_loss']
epochs_range = range(epochs)
plt.figure(figsize=(8, 8))
plt.subplot(1, 2, 1)
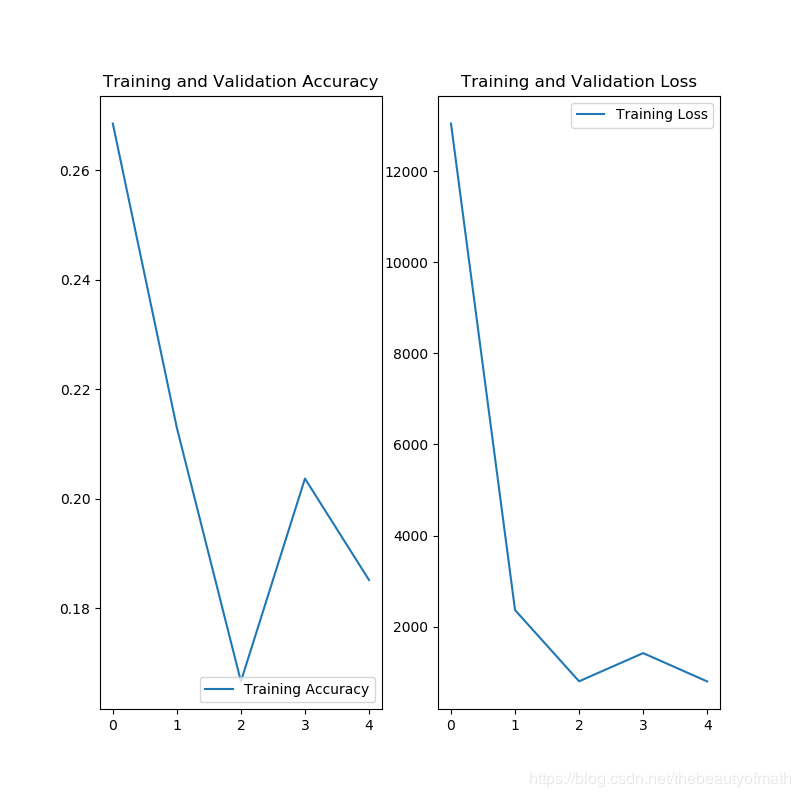
plt.plot(epochs_range, acc, label='Training Accuracy')
# plt.plot(epochs_range, val_acc, label='Validation Accuracy')
plt.legend(loc='lower right')
plt.title('Training and Validation Accuracy')
plt.subplot(1, 2, 2)
plt.plot(epochs_range, loss, label='Training Loss')
plt.plot(epochs_range, val_loss, label='Validation Loss')
plt.legend(loc='upper right')
plt.title('Training and Validation Loss')
plt.show()
这只是一个简单的记录,日后补充。
作者:thebeautyofmath