详解如何用Python实现感知器算法
目录
一、题目
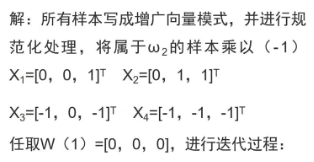
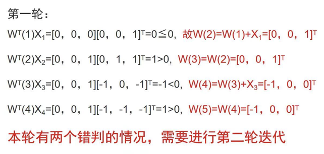
二、数学求解过程
三、感知器算法原理及步骤
四、python代码实现及结果
一、题目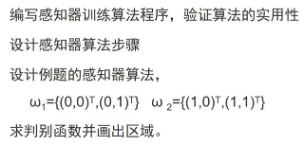
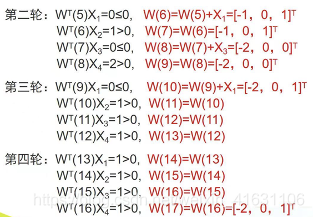
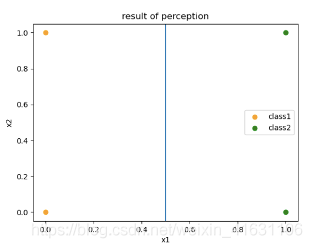
该轮迭代分类结果全部正确,判别函数为g(x)=-2x1+1
三、感知器算法原理及步骤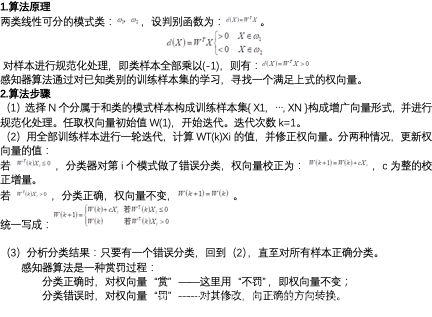
(1)由数学求解过程可知:

(2)程序运行结果

(3)绘图结果
'''
20210610 Julyer 感知器
'''
import numpy as np
import matplotlib.pyplot as plt
def get_zgxl(xn, a):
    '''
    获取增广向量
    :param x: 数组
    :param a: 1或-1
    :return:
    '''
    temp = []
    if a == 1:
        xn.append(1)
    if a == -1:
        for i in range(len(xn)):
            temp.append(xn[i]*(-1))
        temp.append(-1)
        xn = temp
    # print('xn:'+ str(np.array(x).reshape(-1, 1)))
    return np.array(xn).reshape(-1, 1)
def calculate_w(w, xn):
    '''
    已知xn和初始值,计算w
    :param w: 列向量 --> wT:行向量
    :param xn: 列向量
    :return:
    '''
    # wT = w.reshape(1, -1)  # 列向量转变为行向量,改变w
    wT = w.T   # 列向量转变为行向量,不改变w
    wTx = np.dot(wT, xn).reshape(-1)  # 行向量乘以列向量, 维度降为1。
    #wTx = wT@xn  # 行向量乘以列向量
    if wTx > 0:
        w_value = w
    else:
        w_value = np.add(w, xn)
    # print("w_update的shape" + str(w_update.shape))
    #print("wTx:" + str(wTx))
    return w_value, wTx     # w_value为列向量, wTx为一个数
def fit_one(w1, x1, x2, x3, x4):
    '''
    完成一轮迭代,遍历一次数据,更新到w5。
    :param w1: 初始值
    :param x1:
    :param x2:
    :param x3:
    :param x4:
    :return: 返回w5和wTx的列表。
    '''
    wTx_list = []
    update_w = w1
    for i in range(0, len(x_data)): #len计算样本个数,通过循环更新w
        update_w, wTx = calculate_w(update_w, x_data[i])
        wTx_list.append(wTx)
    #print(wTx_list)
    return update_w, wTx_list
def draw_plot(class1, class2, update_w):
    plt.figure()
    x_coordinate = []
    y_coordinate = []
    for i in range(len(class1)):
        x_coordinate.append(class1[i][0])
        y_coordinate.append(class1[i][1])
    plt.scatter(x_coordinate, y_coordinate, color='orange', label='class1')
    x_coordinate = []
    y_coordinate = []
    for i in range(len(class2)):
        x_coordinate.append(class2[i][0])
        y_coordinate.append(class2[i][1])
    plt.scatter(x_coordinate, y_coordinate, color='green', label='class2')
    w_reshape = update_w.reshape(-1)
    #print
    x = np.linspace(0, 2, 5)
    if w_reshape[1] == 0:
        plt.axvline(x = (-1) * w_reshape[2]/w_reshape[0])
    else:
        plt.plot(x, (x*w_reshape[0]*(-1) + w_reshape[2]*(-1))/w_reshape[1])
    plt.title('result of perception')
    plt.xlabel('x1')
    plt.ylabel('x2')
    plt.legend()
    plt.show()
if __name__ == '__main__':
    x1 = [0, 0]
    x2 = [0, 1]
    x3 = [1, 0]
    x4 = [1, 1]
    class1 = [x1, x2]
    class2 = [x3, x4]
    x1 = get_zgxl(x1, 1)
    x2 = get_zgxl(x2, 1)
    x3 = get_zgxl(x3, -1)
    x4 = get_zgxl(x4, -1)
    x_data = [x1, x2, x3, x4]
    # print(x_data)
    w1 = np.zeros((3, 1))  # 初始值w1为列向量
    #print('w1:' + str(w1) + '\n')
    update_w = w1
    update_w, wTx_list = fit_one(update_w, x1, x2, x3, x4)
    count = 0
    iter_number = 0
    for wTx in wTx_list:
        if wTx > 0:
            count += 1
        if count < 4:
            update_w, wTx_list = fit_one(update_w, x1, x2, x3, x4)
            iter_number += 1
        else:
            break
    print('迭代次数为:' + str(iter_number))
    print('迭代终止时的w:'+'\n' + str(update_w))
    #print(wTx_list)
    draw_plot(class1, class2, update_w)
到此这篇关于详解如何用Python实现感知器算法的文章就介绍到这了,更多相关Python实现感知器算法内容请搜索软件开发网以前的文章或继续浏览下面的相关文章希望大家以后多多支持软件开发网!