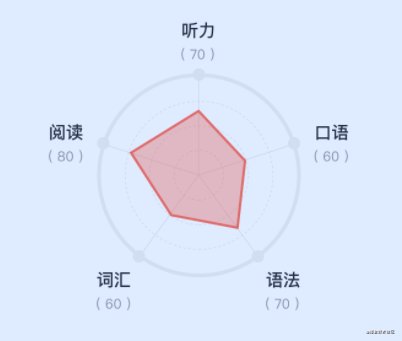
uniapp封装小程序雷达图组件的完整代码
效果图:
view
<canvas id="radar-canvas" class="radar-canvas" type="2d"></canvas>
style
.radar-canvas
    width 550rpx
    height 550rpx
    margin 0 auto
script
<script>
    import { toRpx } from "@/utils/common"
    const numCount = 5  //元素个数
    const numSlot = 4  //一条线上的总节点数
    const mW = toRpx(275) //Canvas的宽度
    const mCenter = mW / 2 //中心点
    const mAngle = Math.PI * 2 / numCount //角度
    const mRadius = mCenter - toRpx(43) //半径(减去的值用于给绘制的文本留空间)
    let canvas = null // canvas
    let canvasCtx = null // canvas context
    export default {
        name: 'RadarChart',
        props: {
        },
        methods: {
            // 初始化雷达图,在组件挂载的时候执行
            initDrawRadar() {
                console.log('init')
                const query = uni.createSelectorQuery().in(this)
                query.select('#radar-canvas').fields({ node: true, size: true }).exec((res) => {
                    canvas = res[0].node
                    canvasCtx = canvas.getContext('2d')
                    const dpr = uni.getSystemInfoSync().pixelRatio
                    canvas.width = res[0].width * dpr
                    canvas.height = res[0].height * dpr
                    canvasCtx.scale(dpr, dpr)
                })
            },
            // 开始执行绘制
            handleDraw(radarData) {
                this.drawEdge()
                this.drawLinePoint()
                this.drawText(radarData)
                this.drawSubText(radarData)
                this.drawEdgeDot()
                this.drawRegion(radarData, 'rgba(255, 105, 81, 0.4)')
            },
            // 绘制圆边
            drawEdge() {
                canvasCtx.strokeStyle = '#EEEEEE'
                for (let i = 0; i < numSlot; i++) {
                    // 计算半径
                    let radius = mRadius / numSlot * (i + 1)
                    if (i === 3) {
                        canvasCtx.lineWidth = toRpx(4)  // 设置线宽
                        canvasCtx.beginPath()
                        canvasCtx.arc(mCenter, mCenter, radius, 0, 2 * Math.PI,) // 开始画圆
                        canvasCtx.stroke()
                    } else {
                        canvasCtx.lineWidth = toRpx(1)
                        const space = 60 + 10 * (i+1)
                        this.drawDashCircle(mCenter, mCenter, radius, space)
                    }
                }
            },
            // 绘制外边框圆点
            drawEdgeDot(x, y) {
                canvasCtx.fillStyle = '#EEEEEF'
                canvasCtx.beginPath()
                for (let k = 0; k < numCount; k++) {
                    let x = mCenter + mRadius * Math.cos(mAngle * k - Math.PI / 2)
                    let y = mCenter + mRadius * Math.sin(mAngle * k - Math.PI / 2)
                    canvasCtx.arc(x, y, toRpx(5), Math.PI * 2, 0, true)
                    canvasCtx.closePath()
                }
                canvasCtx.fill()
            },
            // 绘制虚线圆
            drawDashCircle(x, y, radius, space = 100) {
                const gap = 2 * Math.PI / space
                canvasCtx.lineCap ='square'
                let start = 0; //从原点开始画
                while (start <= 2 * Math.PI) {
                    let end = start + gap
                    canvasCtx.beginPath() //开始一个新的路径
                    canvasCtx.arc(x, y, radius, start, end, false)
                    start = gap + end
                    canvasCtx.stroke() //对当前路径进行描边
                }
            },
            // 绘制连接点
            drawLinePoint() {
                canvasCtx.lineWidth = toRpx(1)
                canvasCtx.beginPath()
                for (let k = 0; k < numCount; k++) {
                    let x = mCenter + mRadius * Math.cos(mAngle * k - Math.PI / 2)
                    let y = mCenter + mRadius * Math.sin(mAngle * k - Math.PI / 2)
                    canvasCtx.moveTo(mCenter, mCenter)
                    canvasCtx.lineTo(x, y)
                }
                canvasCtx.stroke()
            },
            // 绘制文本信息
            drawText(mData) {
                canvasCtx.fillStyle = '#222325'
                canvasCtx.font = `bold ${toRpx(14)}px PingFangSC-Medium, PingFang SC`  //设置字体
                for (let n = 0; n < numCount; n++) {
                    let x = mCenter + mRadius * Math.cos(mAngle * n -  Math.PI / 2)
                    let y = mCenter + mRadius * Math.sin(mAngle * n -  Math.PI / 2)
                    //通过不同的位置,调整文本的显示位置
                    const text = mData[n][0]
                    if (n === 0) {
                        canvasCtx.fillText(text, x - toRpx(12), y - toRpx(30))
                    }
                    if (n === 1) {
                        canvasCtx.fillText(text, x + toRpx(12), y)
                    }
                    if (n === 2) {
                        canvasCtx.fillText(text, x + toRpx(12), y + toRpx(20))
                    }
                    if (n === 3) {
                        canvasCtx.fillText(text, x - toRpx(36), y + toRpx(20))
                    }
                    if (n === 4) {
                        canvasCtx.fillText(text, x - toRpx(40), y)
                    }
                }
            },
            // 绘制文本信息
            drawSubText(mData) {
                canvasCtx.fillStyle = '#8D949B'
                canvasCtx.font = `${toRpx(11)}px PingFangSC-Medium, PingFang SC`  //设置字体
                for (let n = 0; n < numCount; n++) {
                    const x = mCenter + mRadius * Math.cos(mAngle * n -  Math.PI / 2)
                    const y = mCenter + mRadius * Math.sin(mAngle * n -  Math.PI / 2)
                    //通过不同的位置,调整文本的显示位置
                    const text = `(${mData[n][1]})`
                    if (n === 0) {
                        canvasCtx.fillText(text, x - canvasCtx.measureText(text).width / 2, y - toRpx(10))
                    }
                    if (n === 1) {
                        canvasCtx.fillText(text, x + canvasCtx.measureText(text).width, y + toRpx(16))
                    }
                    if (n === 2) {
                        canvasCtx.fillText(text, x + canvasCtx.measureText(text).width - toRpx(4), y + toRpx(40))
                    }
                    if (n === 3) {
                        canvasCtx.fillText(text, x - canvasCtx.measureText(text).width - toRpx(12), y + toRpx(40))
                    }
                    if (n === 4) {
                        canvasCtx.fillText(text, x - canvasCtx.measureText(text).width - toRpx(16), y + toRpx(16))
                    }
                }
            },
            //绘制红色数据区域(数据和填充颜色)
            drawRegion(mData, color){
                canvasCtx.strokeStyle = '#FF6951'
                canvasCtx.lineWidth = toRpx(4)  // 设置线宽
                canvasCtx.beginPath()
                for (let m = 0; m < numCount; m++){
                    let x = mCenter + mRadius * Math.cos(mAngle * m - Math.PI / 2) * mData[m][1] / 100
                    let y = mCenter + mRadius * Math.sin(mAngle * m - Math.PI / 2) * mData[m][1] / 100
                    canvasCtx.lineTo(x, y)
                }
                canvasCtx.closePath()
                canvasCtx.fillStyle = color
                canvasCtx.fill()
                canvasCtx.stroke()
            },
        },
        mounted() {
            this.initDrawRadar()
        }
    }
</script>
要注意的点是,这里是封装成组件调用,在初始化的时候,const query = uni.createSelectorQuery().in(this),要加上in(this),否则会报找不到node节点的错误信息
export function toRpx(val) {
    const res = uni.getSystemInfoSync()
    const scaleRate = res.windowWidth / 375
    return val * scaleRate
}
在页面中调用
<template>
    <!--雷达图-->
    <radar-chart :radarData="radarData" ref="radarRef"></radar-chart>
</template>
import RadarChart from './components/radar'
export default {
    components: {
        RadarChart,
    },
    data() {
        return {
            radarData:[["听力", 0], ["口语",0], ["语法",0], ["词汇",0], ["阅读",0]],
        }
    },
    methods: {
        getData() {
            // 请求数据返回后,调用组件方法渲染
            this.$refs.radarRef.handleDraw(this.radarData)
        }
    }
}
总结
到此这篇关于uniapp封装小程序雷达图组件的文章就介绍到这了,更多相关uniapp封装小程序雷达图组件内容请搜索软件开发网以前的文章或继续浏览下面的相关文章希望大家以后多多支持软件开发网!