使用pytoch简洁创建隐层,拟合正弦函数,深入理解深度学习是一种高维非线性拟合
网上关于拟合直线和二次曲线的教程已经很多,隐藏层设置差不多1到2层,便可以得到很好的拟合效果。更加复杂的几何函数,需要更多的隐藏层来进行拟合,逐层进行定义必然很繁琐还容易出错。
我们知道深度神经网络的本质是输入端数据和输出端数据的一种高维非线性拟合,如何更好的理解它,下面尝试拟合一个正弦函数,本文可以通过简单设置节点数,实现任意隐藏层数的拟合。
基于pytorch的深度神经网络实战,无论任务多么复杂,都可以将其拆分成必要的几个模块来进行理解。
1)构建数据集,包括输入,对应的标签y
2) 构建神经网络模型,一般基于nn.Module继承一个net类,必须的是__init__函数和forward函数。__init__构造函数包括创建该类是必须的参数,比如输入节点数,隐藏层节点数,输出节点数。forward函数则定义了整个网络的前向传播过程,类似于一个Sequential。
3)实例化上步创建的类。
4)定义损失函数(判别准则),比如均方误差,交叉熵等
5)定义优化器(optim:SGD,adam,adadelta等),设置学习率
6)开始训练。开始训练是一个从0到设定的epoch的循环,循环期间,根据loss,不断迭代和更新网络权重参数。训练阶段可以分为几个部分:
1.前向传播,得到out【out = net(x)】
2.根据out和数据的标签,计算loss【loss = loss_func(out, y)】
3.根据optimizer将梯度置为0【optimzer.zero_grad()】
4.损失的反向传播【loss.backward()】
5.optimizer的迭代【optimzer.step()】
无论多么复杂的网络,基于pytorch的深度神经网络都包括6个模块,训练阶段包括5个步骤,本文只通过拟合一个正弦函数来说明加深理解。
一、构建数据集,包括输入,对应的标签y,创建了一个1000个点的数据
def get_fake_data(batch_size=1000):
    x = torch.unsqueeze(torch.linspace(-10,10,batch_size), dim=1)
    y = np.sin(x)
    return x, y
二、构建神经网络模型
为了避免手动输入隐藏层节点和操作的繁琐,使用make_layer来创建一定数量的隐藏层,这里参照了pytorch vgg的构造方法。
①定义创建层的函数(最后一层输出不能激活)
def make_layers(cfg):
    layers = []
    input_dim = cfg[0]
    for v in cfg[1:-1]:
        linear = torch.nn.Linear(input_dim, v)
        layers += [linear, torch.nn.ReLU()]
        input_dim = v
    linear = torch.nn.Linear(cfg[-2], cfg[-1])
    layers += [linear]
    return torch.nn.Sequential(*layers)
②定义网络模型
class LinerRegress(torch.nn.Module):
    def __init__(self, features):
        super(LinerRegress, self).__init__()
        self.features = features
    def forward(self, x):
        x = self.features(x)
        return x
三、实例化神经网络模型,cfg是节点数列表,两端的1表示输入和输出的节点,中间表示各个隐藏层的节点。这里定义了7个隐藏层,节点数分别为20,50,100,500,100,50,20。
cfg = [1,20,50,100,500,100,50,20,1]
net = LinerRegress(make_layers(cfg))
四、定义损失函数
loss_func = torch.nn.MSELoss()
五、定义优化器,对net.parameters进行优化更新,设置学习率
optimzer = optim.SGD(net.parameters(), lr=5e-2)
六、开始训练(可视化过程,参考了movanpython)
for i in range(10000):
    # 前向传播
    out = net(x)
    # 计算loss,打印loss
    loss = loss_func(out, y)
    print(i, loss.item())
    # 梯度归0
    optimzer.zero_grad()
    # 反向传播
    loss.backward()
    # 参数更新
    optimzer.step()
    # 画图
    if i % 5 ==0:
        plt.cla()
        plt.scatter(x.data.numpy(), y.data.numpy())
        plt.plot(x.data.numpy(), out.data.numpy(), 'r-', lw=5)
        plt.text(-10, 0.75, 'iter=%d\nLoss=%.4f' % (i, loss.data.numpy()), fontdict={'size': 10, 'color': 'red'})
        plt.title('hidden_layer:' +  str(len(cfg)-2))
        plt.pause(0.01)
八、可以设置隐藏层个数来观察拟合情况
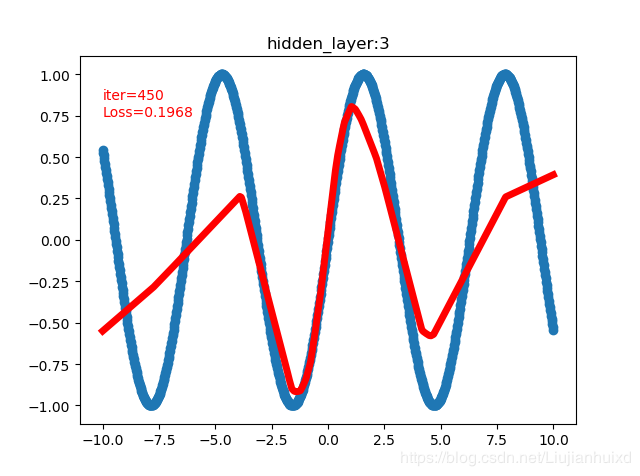
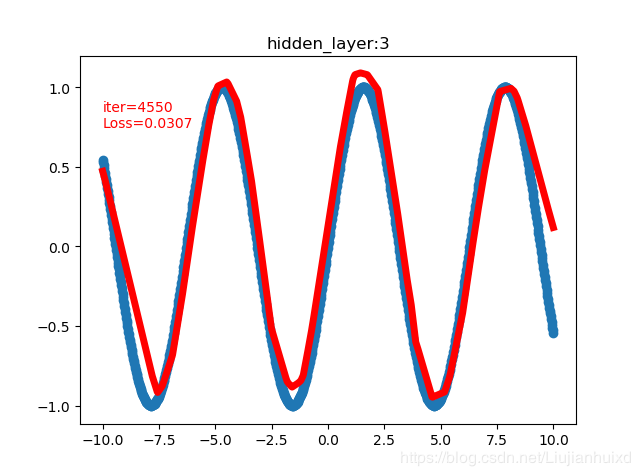
cfg = [1,20,50,20,1]时,4999 0.01936902292072773,附上两张过程图


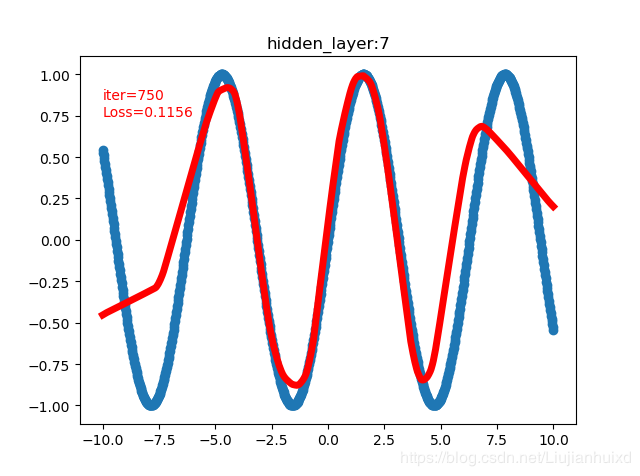
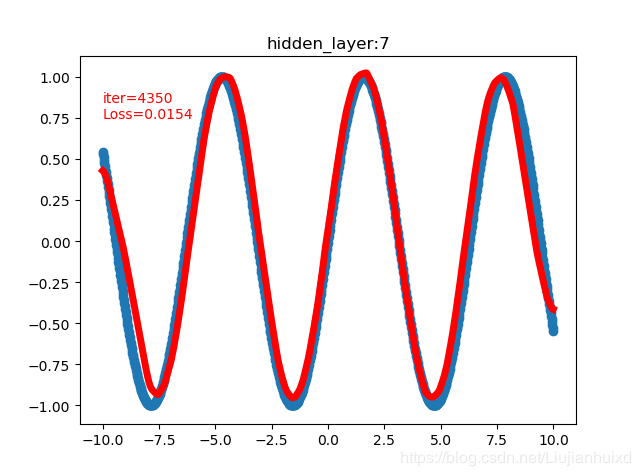
cfg = [1,20,50,100,500,100,50,20,1]时,4999 0.013793441466987133,附上两张过程图


九、查看网络参数
训练得到的网络参数都包含在net.parameters里面。
采用的时linear方式,所有每层计算量包括w和b两类,首先转化为list形式,除以2,得到计算的权重和偏置有八类。
查看他们的shape
权重参数都
para = list(net.parameters())
print('该网络共包含参数', len(para)/2)
for i in range(0,int(len(para)/2)):
    print('第{}参数,weight shape={},bias shape={}'.format(i+1, para[2*i].data.numpy().shape, para[2*i+1].data.numpy().shape))
该网络共包含参数 8.0
第1参数,weight shape=(20, 1),bias shape=(20,)
第2参数,weight shape=(50, 20),bias shape=(50,)
第3参数,weight shape=(100, 50),bias shape=(100,)
第4参数,weight shape=(500, 100),bias shape=(500,)
第5参数,weight shape=(100, 500),bias shape=(100,)
第6参数,weight shape=(50, 100),bias shape=(50,)
第7参数,weight shape=(20, 50),bias shape=(20,)
第8参数,weight shape=(1, 20),bias shape=(1,)
查看第一个网络参数weight
para[0].data.numpy()
array([[ 0.79877895],
[ 0.77982694],
[-0.7373237 ],
[ 0.33444697],
[ 0.58287495],
[-0.8124553 ],
[-0.87875056],
[-0.9483114 ],
[ 0.01769696],
[ 0.973248 ],
[ 0.56268686],
[-0.7496053 ],
[-0.72033334],
[ 0.441311 ],
[-0.3943931 ],
[ 0.3030247 ],
[-0.08382248],
[ 0.47333398],
[ 0.7837978 ],
[-0.5667472 ]], dtype=float32)
这就是权重,可以类比为后续其他分类识别任务的卷积核。
作者:从入门到秃头2019