利用Batch梯度下降法求解线性回归方程
import numpy as np
import matplotlib.pyplot as plt
def loadDataSet(fileName,delim = '\t'):
    fr = open(fileName)
    stringArr = [line.strip().split(delim) for line in fr.readlines()]
    datArr = [list(map(float, line)) for line in stringArr]
    datArr = np.mat(datArr)[:, 1:]
    m, n = np.shape(datArr)
    return datArr, m, n
datArr, m ,n = loadDataSet("ex0.txt",delim = "\t")
def regressionFunc(a, b, x):  #求解预测值
    y_ = a + b * x
    return y_
def lossFunc(a, b, m):   #代价函数
    y = datArr[:, 1]
    y_ = regressionFunc(a, b, datArr[:,0])
    J = (1 / (2 * m)) * np.sum(np.square(y_ - y))
    return J
def aGrad(a, b, datArr, m):   #a的偏导数
    y = datArr[:, 1]
    a = (1 / m) * np.sum(regressionFunc(a, b, datArr[:, 0])-y)
    return a
def bGrad(a, b, datArr, m):  #b的偏导数
    y = datArr[:, 1]
    b = (1 / m) * np.sum(np.multiply((regressionFunc(a, b, datArr[:, 0])-y), datArr[:, 0]))
    return b
def gradientFunc(a, b, datArr, alfa, iter):   #梯度下降法
    tempJ = np.zeros((iter, 1))
    finishIter = iter
    for i in range(iter):
        tempJ[i] = lossFunc(a, b, m)
        tempa = a - alfa * aGrad(a, b, datArr, m)
        tempb = b - alfa * bGrad(a, b, datArr, m)
        lasta = a
        lastb = b
        a = tempa
        b = tempb
        if lasta == a and lastb == b:
            finishIter = i
            break
    J = lossFunc(a, b, m)
    return J, a, b, tempJ, finishIter
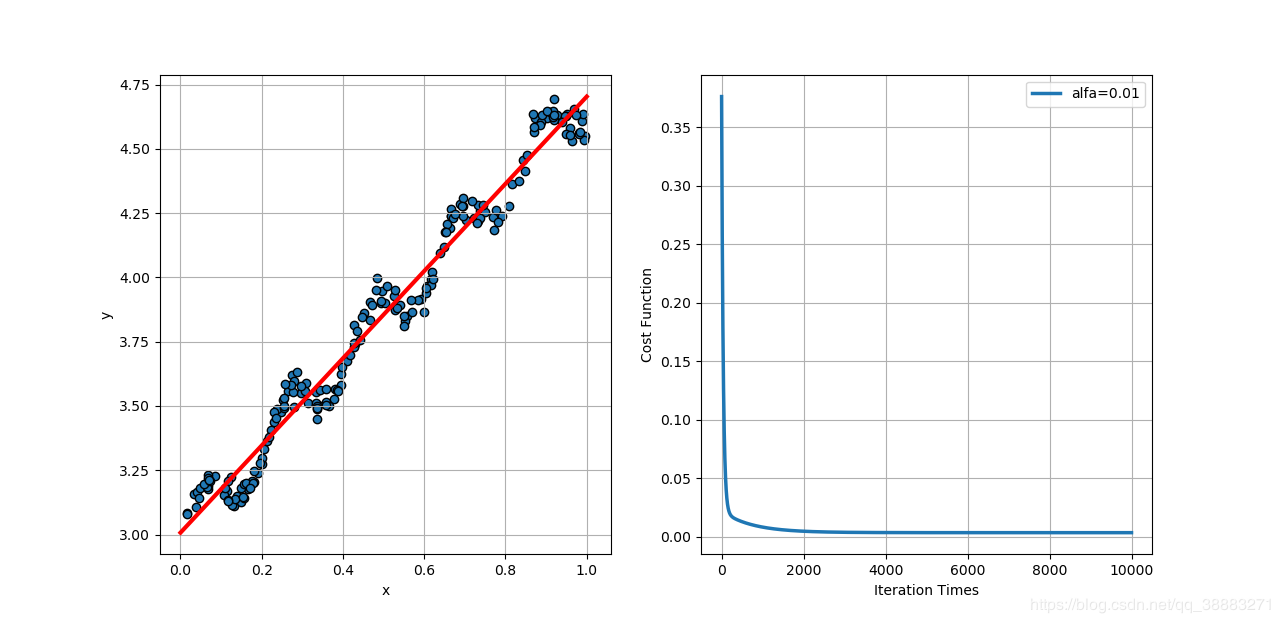
J, a, b, tempJ, finishIter = gradientFunc(2, 2, datArr, 0.01, 10000)
print("误差平方和的平均值为:", '%.4f' % J)
x = np.linspace(0, 1, 1000)
y = a + b * x
fig = plt.figure()
ax1 = fig.add_subplot(121)
ax1.scatter(datArr[:, 0].tolist(), datArr[:, 1].tolist(), edgecolors='k')
ax1.plot(x, y, color='r', linewidth=3)
plt.xlabel("x")
plt.ylabel("y")
plt.grid()
ax2 = fig.add_subplot(122)
ax2.plot(tempJ[:finishIter], linewidth=2.5)
plt.xlabel("Iteration Times")
plt.ylabel("Cost Function")
plt.grid()
plt.show()

误差平方和的平均值为: 0.0034
当学习速率取0.1时,代价函数相比学习速率为0.01时收敛的更快一些

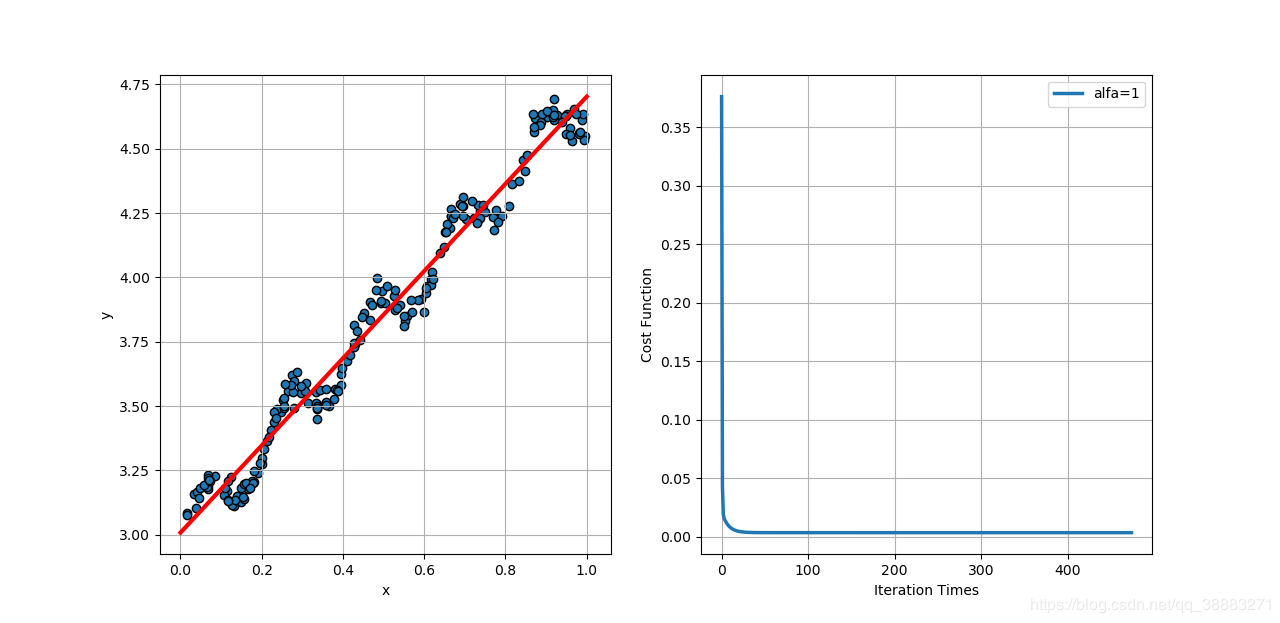
当学习速率取1时,代价函数相比学习速率为0.1时收敛的更快了,并且当学习速率大于1时代价函数开始发散。所以要合理设置学习速率的值,过小收敛速度过慢迭代次数多,过大容易发散不能得到回归结果。

作者:Legolas~