Pytorch|用Tensor和Variable实现线性回归
import torch as t
%matplotlib inline
from matplotlib import pyplot as plt
from IPython import display
batch_size是“一批”的大小,每处理完一批之后都会更新一次参数。如果batch_size=1,则为随机梯度下降法;1<batch_size<样本数则为小批量梯度下降;batch_size=样本数则为批量梯度下降。
这里batch_size=8=样本数,但为什么书上还是说这是随机梯度下降呢?
这个函数产生了训练集,共8个样本,每个样本的input就是一个实数,output也是一个实数,所以x是一个1*8的向量。
t.manual_seed(1000)
def get_fake_data(batch_size=8):
    '''产生随机数据:y=x*2+3 加上了一些噪声'''
    x=t.rand(batch_size,1)*20   #rand:0,1均匀分布
    y=x*2+(1+t.randn(batch_size,1))*3
    return x,y
#随机初始化参数
w=t.rand(1,1)
b=t.zeros(1,1)
lr=0.001 #学习率
for ii in range(20000):
    x,y=get_fake_data()
    #forward:计算loss
    y_pred=x.mm(w)+b.expand_as(y)
    loss=0.5*(y_pred-y)**2  #均方误差
    loss=loss.sum()
    #backward:手动计算梯度
    dloss=1
    dy_pred=dloss*(y_pred-y)
    dw=x.t().mm(dy_pred)
    db=dy_pred.sum()
    #更新参数
    w.sub_(lr*dw)
    b.sub_(lr*db)
    if ii%1000 == 0:
        #画图
        display.clear_output(wait=True)
        x=t.arange(0,20).view(-1,1)
        y=x.float().mm(w)+b.expand_as(x)
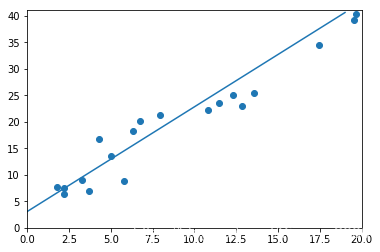
        plt.plot(x.numpy(),y.numpy()) #predicted
        x2,y2=get_fake_data(batch_size=20)
        plt.scatter(x2.numpy(),y2.numpy()) #true data
        plt.xlim(0,20)
        plt.ylim(0,41)
        plt.show()
        plt.pause(0.5)
print(w,b)
t.arange(0,20)产生的是整型numpy,为了变成浮点型,用x.float()之外,也可以把x写作t.arange(0.,20.)
plt.scatter的输入必须是numpy,所以这里用了tensor.numpy()函数;后面用Variable实现的时候也是一样(绘图时x和y都是tensor而不是Variable)。
最后的输出是这样的:

tensor([[2.1143]]) tensor([[3.0964]])
最后的输出是1*1的tensor,所以如果把w和b进行维度压缩的话,或许可以输出实数。
print(w.data.squeeze(0),b.data.squeeze(0))
print(w.data.squeeze(),b.data.squeeze())
结果:
tensor([1.9685]) tensor([3.1115])
tensor(1.9685) tensor(3.1115)
可见1维和0维(或许可以这么说吗)的tensor有中括号和小括号的区别。
不过书上的写法是print(w.squeeze()[0],b.sqeeze()[0]),我很不明白,而且也会报错。
import torch as t
from torch.autograd import Variable as V
%matplotlib inline
from matplotlib import pyplot as plt
from IPython import display
t.manual_seed(1000)
def get_fake_data(batch_size=8):
    x=t.rand(batch_size,1)*20
    y=x*2+(1+t.randn(batch_size,1))*3
    return x,y
w=V(t.rand(1,1),requires_grad=True)
b=V(t.zeros(1,1),requires_grad=True)
lr=0.001
for ii in range (8000):
    x,y=get_fake_data()
    x,y=V(x),V(y)
    y_pred=x.mm(w)+b.expand_as(y)
    loss=0.5*(y_pred-y)**2
    loss=loss.sum()
    loss.backward()
    w.data.sub_(lr*w.grad.data)
    b.data.sub_(lr*b.grad.data)
    w.grad.data.zero_()
    b.grad.data.zero_()
    if ii%1000 == 0:
        display.clear_output(wait=True)
        x=t.arange(0,20).view(-1,1)
        y=x.float().mm(w.data)+b.data.expand_as(x)
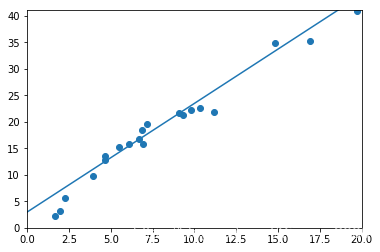
        plt.plot(x.numpy(),y.numpy())
        x2,y2=get_fake_data(batch_size=20)
        plt.scatter(x2.numpy(),y2.numpy())
        plt.xlim(0,20)
        plt.ylim(0,41)
        plt.show()
        plt.pause(0.5)
print(w.data.squeeze(),b.data.squeeze())
输出如下:

tensor(1.9373) tensor(3.0661)
这里用get_fake_data得到训练集后的第一步就是把它们转换成Variable,在更新参数、梯度清零、压缩维度时用Variable.data转换成Tensor。
前向传播和绘制拟合曲线是都用了y=wx+b,但是前向传播时x,w,b都是Variable,绘制拟合曲线时x,w,b都是Tensor。
y_pred=x.mm(w)+b.expand_as(y)  #前向传播
y=x.float().mm(w.data)+b.data.expand_as(x)  #绘制拟合曲线
是不是只要同一个式子变量数据类型符合一致就可以了呢?
其实把绘制曲线部分全部用Variable写也可以的,就像这样:
    if ii%1000 == 0:
        display.clear_output(wait=True)
        x=V(t.arange(0,20).view(-1,1))
        y=x.float().mm(w)+b.expand_as(x)
        plt.plot(x.data.numpy(),y.data.numpy())
要注意只有Tensor.numpy()而没有Variable.numpy()。
不过前向传播好像改了改会报错,但是谁会做这么没有美感的改动呢。
for ii in range (8000):
    x,y=get_fake_data()
    x,y=V(x),V(y)
    y_pred=V(x.data.mm(w.data)+b.data.expand_as(y.data))
    loss=0.5*(y_pred-y)**2
    loss=loss.sum()
报错:
RuntimeError: element 0 of tensors does not require grad and does not have a grad_fn
另:每次都要手动清零,是因为pytorch的梯度默认叠加。如果不清零的话,w和b就会变成nan,输出如下:

tensor(nan) tensor(nan)
作者:Yinger_2000