统计学习方法——感知机python实现(附训练迭代动画)
使用感知机对iris数据集中的前两维特征构成的数据点分类
作者:WWtianxiang
import numpy as np
import pandas as pd
from sklearn.datasets import load_iris
import matplotlib.pyplot as plt
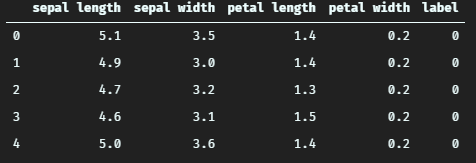
iris = load_iris()
df = pd.DataFrame(iris.data, columns=iris.feature_names)
df['label'] = iris.target
df.columns = [
'sepal length', 'sepal width', 'petal length', 'petal width', 'label'
]
df.head()
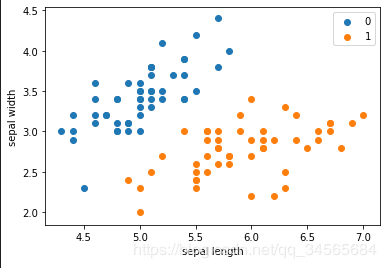
plt.scatter(df[:50]['sepal length'], df[:50]['sepal width'], label='0')
plt.scatter(df[50:100]['sepal length'], df[50:100]['sepal width'], label='1')
plt.xlabel('sepal length')
plt.ylabel('sepal width')
plt.legend()
data = df.iloc[:100,[0,1,-1]]
data.loc[data['label'] == 0,'label'] = -1
train = data.values[:,:2]
traget = data.values[:,-1]
class perceptron:
def __init__(self):
self.w = np.zeros((2,1),dtype=np.float)
self.b = 0
self.lr = 0.1
def fit(self,x,y):
error = [(x[0,:],y[0])]
w0 = []
w1 = []
b = []
while error != []:
data, traget = error.pop()
w0.append(self.w[0])
w1.append(self.w[1])
b.append(self.b)
self.w = self.w + self.lr*traget*data.reshape(2,1)
self.b = self.b + self.lr*traget
for i in range(x.shape[0]):
if np.sign(np.dot(x[i,:].reshape(1,2),self.w) + self.b) * y[i] < 0:
error.append((x[i,:],y[i])) #将分错的数据加入列表
print('Done!')
return w0,w1,b
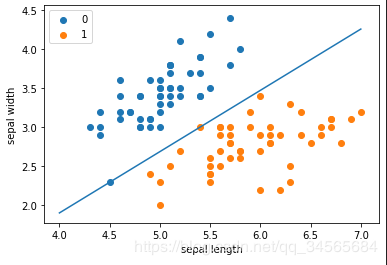
model = perceptron()
w0,w1,b = model.fit(train,traget)
print(len(w0))
x = np.linspace(4,7,10)
f = (-model.w[0]*x - model.b)/model.w[1]
plt.plot(x,f)
plt.scatter(df[:50]['sepal length'], df[:50]['sepal width'], label='0')
plt.scatter(df[50:100]['sepal length'], df[50:100]['sepal width'], label='1')
plt.xlabel('sepal length')
plt.ylabel('sepal width')
plt.legend()
plt.show()
Gif画图代码
import matplotlib.animation as animation
def update_points(num):
    '''
    更新数据点
    '''
    point_ani.set_data(x, (-w0[num]*x - b[num])/w1[num])
    return point_ani,
fig = plt.figure()
plt.scatter(df[:50]['sepal length'], df[:50]['sepal width'], label='0')
plt.scatter(df[50:100]['sepal length'], df[50:100]['sepal width'], label='1')
plt.xlabel('sepal length')
plt.ylabel('sepal width')
plt.legend()
x = np.linspace(4,7,10)
y = (-w0[0]*x - b[0])/w1[0]
point_ani, = plt.plot(x, y)
ani = animation.FuncAnimation(fig, update_points, np.arange(0, len(w0), 100), interval=100, blit=True)
ani.save('perceptron.gif', writer='pillow', fps=10)
作者:WWtianxiang