SpringBoot thymeleaf实现饼状图与柱形图流程介绍
今天给大家带来的是一个用SpringBoot + thymeleaf显示出饼状图和柱形图
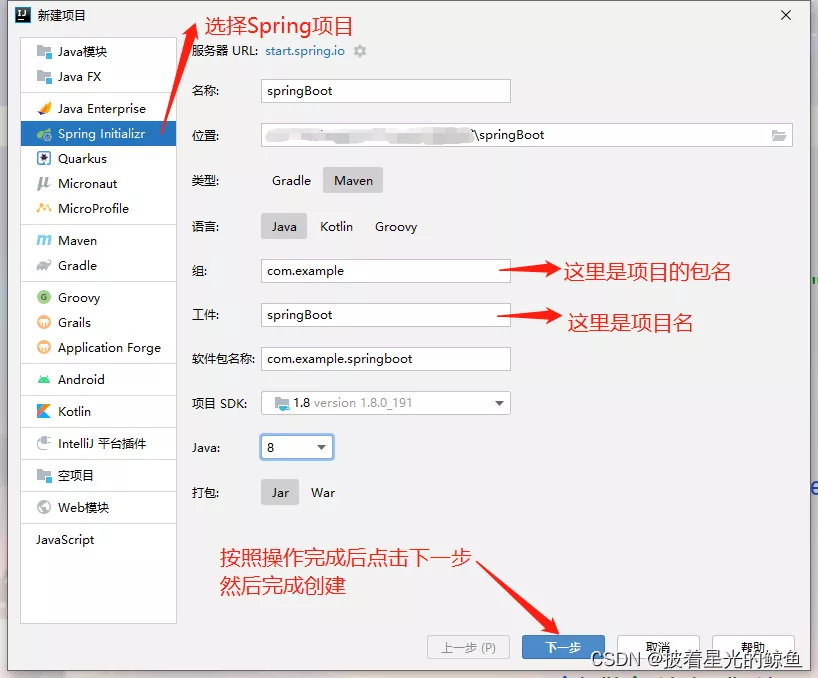
首先我们先创建项目 注意:创建SpringBoot项目时一定要联网不然会报错
项目创建好后我们首先对 application.yml 进行编译

#指定端口号
server:
port: 8888
#配置mysql数据源
spring:
datasource:
driver-class-name: com.mysql.cj.jdbc.Driver
url: jdbc:mysql://localhost:3306/nba?serverTimezone=Asia/Shanghai
username: root
password: root
#配置模板引擎 thymeleaf
thymeleaf:
mode: HTML5
cache: false
suffix: .html
prefix: classpath:/templates/
mybatis:
mapper-locations: classpath:/mapper/*.xml
type-aliases-package: com.bdqn.springboot #放包名
接下来我们写后端代码
mapper层
package com.bdqn.springbootexcel.mapper;
import com.bdqn.springbootexcel.pojo.User;
import org.apache.ibatis.annotations.Insert;
import org.apache.ibatis.annotations.Mapper;
import org.apache.ibatis.annotations.Select;
import java.util.List;
@Mapper
public interface UserMapper {
    @Select("select * from user")
    List<User> find();
    @Insert("insert into user ( name, age, sex) values ( #{name}, #{age}, #{sex})")
    int add(User user);
}
实体类
package com.bdqn.springbootexcel.pojo;
import com.alibaba.excel.annotation.ExcelProperty;
import lombok.Data;
@Data
public class User {
    @ExcelProperty(index = 0,value = "用户编号")
    private Integer id;
    @ExcelProperty(index = 1,value = "用户姓名")
    private String name;
    @ExcelProperty(index = 2,value = "用户年龄")
    private String age;
    @ExcelProperty(index = 3,value = "用户性别")
    private String sex;
}
现在编写最重要的前端代码
index.html
<!DOCTYPE html>
<html lang="en" xmlns:th="http://www.thymeleaf.org">
<html lang="en">
<head>
    <meta charset="UTF-8">
    <title>Title</title>
</head>
<body>
    <!--饼状图-->
    <div id="pie" style="width:800px;height:600px;"></div>
    <script th:src="@{https://cdn.bootcdn.net/ajax/libs/echarts/5.4.0/echarts.min.js}"></script>
    <script>
        option = {
            title: {
                text:'饼图示例',
                subtext:'纯属虚构',
                left:'center'
            },
            legend: {
                top: 'bottom'
            },
            tooltip:{
                trigger:'item'
            },
            toolbox: {
                show: true,
                feature: {
                    mark: { show: true },
                    dataView: { show: true, readOnly: false },
                    restore: { show: true },
                    saveAsImage: { show: true }
                }
            },
            series: [
                {
                    name: 'Nightingale Chart',
                    type: 'pie',
                    radius: [50, 250],
                    center: ['50%', '50%'],
                    roseType: 'area',
                    itemStyle: {
                        borderRadius: 8
                    },
                    data: [
                    ]
                }
            ]
        };
        var chartDom = document.getElementById('pie');
        var myChart = echarts.init(chartDom);
        fetch("/pojos_bing").then(response => response.json()).then(res => {
            res.forEach(item => {
                //name 和 age 都是数据库中的值
                option.series[0].data.push({name: item.name,value: item.age})
            })
            myChart.setOption(option);
        })
    </script>
    <!--柱状图-->
    <div style="height: 50px;"></div>
    <div id="bar" style="width: 1000px;height: 800px;"></div>
    <script>
        barOption = {
            title: {
                text: '柱状图'
            },
            legend: {
                top: 'top'
            },
            tooltip: {
                trigger: 'axis'
            },
            xAxis: {
                type: 'category',
                data: []
            },
            yAxis: {
                type: 'value'
            },
            series: [
                {
                    name: '11',
                    data: [],
                    type: 'bar'
                },
                {
                    name: '22',
                    data: [],
                    type: 'bar'
                }
            ]
        };
        var barDom = document.getElementById('bar');
        var barChart = echarts.init(barDom);
        fetch("/pojos_bing").then(response => response.json()).then(res => {
            //name 和 age 都是数据库中的值
            const name= res.map(v => v.name);
            barOption.xAxis.data = name
            const age= res.map(v => v.age);
            barOption.series[0].data = age
            barChart.setOption(barOption)
        })
    </script>
</body>
</html>
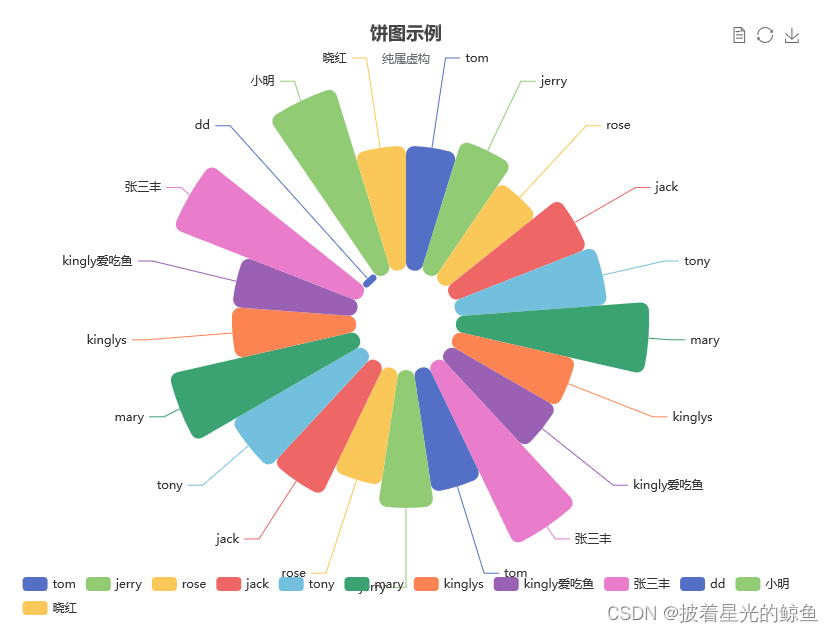
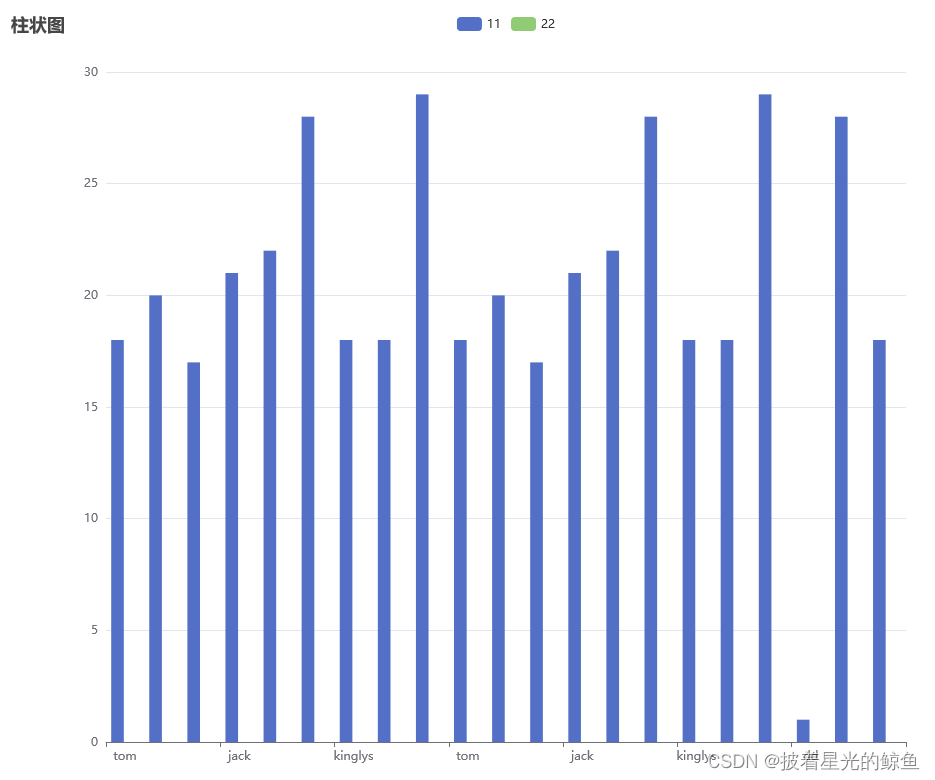
现在我们看看前端展示效果
到此这篇关于SpringBoot thymeleaf实现饼状图与柱形图流程介绍的文章就介绍到这了,更多相关SpringBoot饼状图与柱形图内容请搜索软件开发网以前的文章或继续浏览下面的相关文章希望大家以后多多支持软件开发网!