数字图像处理 - 实验作业一 - Python
文章目录第二章 数字图像基础1、用程序实现同时对比度实验2、用程序实验空间分辨率变化效果3、用程序实验幅度分辨率变化效果
第二章 数字图像基础
作者:沉默的溪
这几个题目网上有很多MATLAB版的解答,这里自己写了一个python的版本,实现的思路是基本一致的
依赖库
import matplotlib.pyplot as plt
import matplotlib.image  as img
import numpy as np
import math
%matplotlib inline
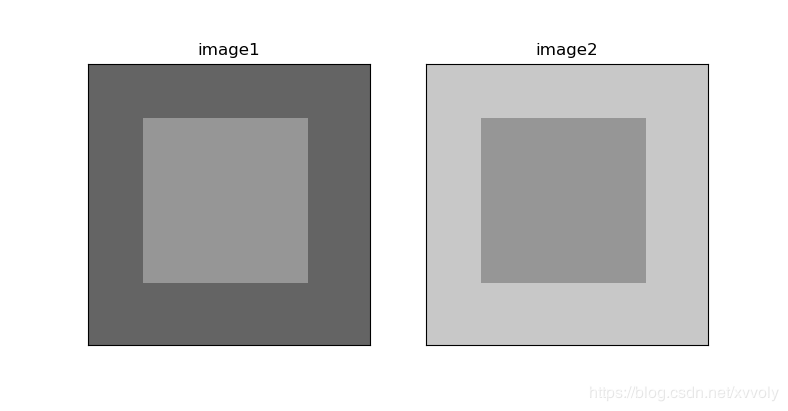
1、用程序实现同时对比度实验
程序代码:
# set image size
height = 256
weight = 256
channel = 3
img_size = (height, weight, channel)
img_list = []
# R=G=B gray
light_gray = 200
deep_gray = 100
center_gray = 150
img_1 = np.ones(img_size, dtype = int) * deep_gray
img_2 = np.ones(img_size, dtype = int) * light_gray
img_1[50:200, 50:200,:] = center_gray
img_2[50:200, 50:200,:] = center_gray
img_list = [img_1, img_2]
_, axs = plt.subplots(1, 2, figsize=(8,8))
for i in range(len(axs)):
    axs[i].set_title("image"+str(i+1))
    axs[i].imshow(img_list[i])
    axs[i].axes.get_xaxis().set_visible(False)
    axs[i].axes.get_yaxis().set_visible(False)
plt.show()
输出结果:

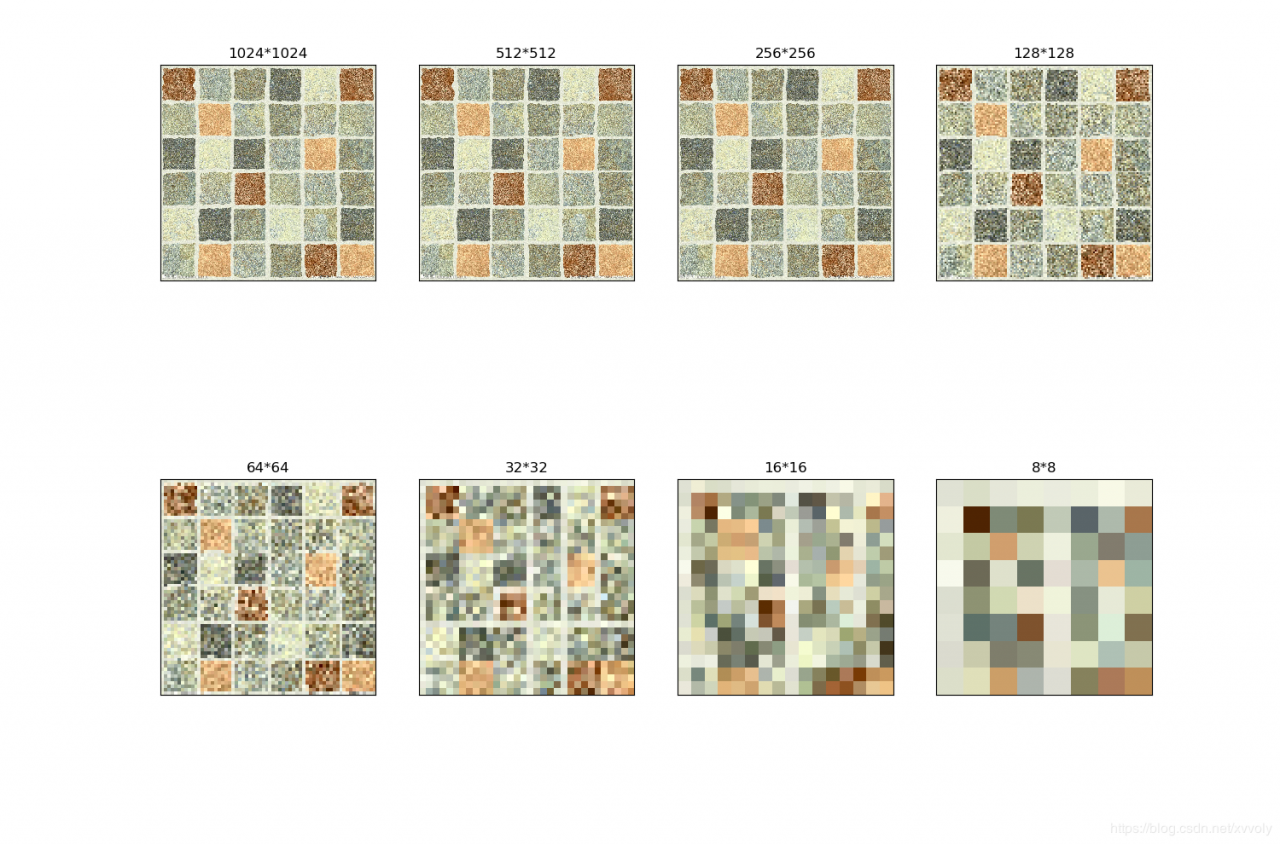
本题和下一题使用的原图
大小为1024*1024
程序代码:
timg_1024 = img.imread("timg.jpg")
m, n ,c = timg_1024.shape
img_list = []
img_list_name = []
index = [int(math.pow(2,i)) for i in range(8)]
for i in index:
    img_list.append(timg_1024[1:m:i, 1:n:i, :])
    img_size = [int(1024/i),int(1024/i)]
    img_list_name.append(img_size)
row = 2
col = 4
_, axs = plt.subplots(row, col, figsize=(15,15))
plt.subplots_adjust(top=0.4,bottom=0)  # 两行输出的行间距
for i in range(row):
    for j in range(col):
        axs[i][j].set_title(str(img_list_name[i*4+j][0])
                            +"*"+str(img_list_name[i*4+j][1]))
        axs[i][j].imshow(img_list[i*4+j])
        axs[i][j].axes.get_xaxis().set_visible(False)
        axs[i][j].axes.get_yaxis().set_visible(False)
plt.show()
输出结果:

程序代码:
timg_1024 = img.imread("timg.jpg")
m, n ,c = timg_1024.shape
img_list = []
img_new = np.ndarray((1024,1024,3),dtype=int)
img_list_name = []
index = [int(math.pow(2,i)) for i in range(8)]
for i in index:
    img_new = np.int64(i * np.round(timg_1024/i))
    img_new[img_new > 255] = 255  # 出界限制
    img_list.append(img_new)
    img_list_name.append("Amplitude"+str(i))
row = 2
col = 4
_, axs = plt.subplots(row, col, figsize=(15,15))
plt.subplots_adjust(top=0.4,bottom=0)
for i in range(row):
    for j in range(col):
        axs[i][j].set_title(img_list_name[i*4+j])
        axs[i][j].imshow(img_list[i*4+j])
        axs[i][j].axes.get_xaxis().set_visible(False)
        axs[i][j].axes.get_yaxis().set_visible(False)
plt.show()
输出图像:

遇到的一点意外:
本来在实验3中用的幅度变化的方式是
for i in index:
    for j in range(m):
        for k in range(n):
            img_new[j,k] = i * np.round(timg_1024[j,k]/i)
            for l in img_new[j,k]:
                if l > 255:
                    print("error")
    img_list.append(img_new)
    img_list_name.append("Amplitude"+str(i))
但是由于循环太多,运行速度太慢了,改成了
for i in index:
    img_new = np.int64(i * np.round(timg_1024/i))
    img_new[img_new > 255] = 255  # 出界限制
    img_list.append(img_new)
    img_list_name.append("Amplitude"+str(i))
总结:完成了三个小实验,但由于刚接触python不久,很多地方还不是很完善,以后会慢慢熟练的,欢迎批评与指正
作者:沉默的溪