数据挖掘学习记录三
数据挖掘的学习和细节思考
作者:出门左拐是海
(自己学习记录使用)
本次学习是在二手车价格数据的分析的基础上,根据他人的文章进行研究学习。通过细分步骤和深究每一步的意义,对于数据挖掘有一个更好的认识。
参考链接为:Datawhale 零基础入门数据挖掘-Task4 建模调参
import pandas as pd
import numpy as np
import warnings
warnings.filterwarnings('ignore')
def reduce_mem_usage(df):
    """ iterate through all the columns of a dataframe and modify the data type
        to reduce memory usage.
    """
    start_mem = df.memory_usage().sum()
    print('Memory usage of dataframe is {:.2f} MB'.format(start_mem))
    for col in df.columns:
        col_type = df[col].dtype
        if col_type != object:
            c_min = df[col].min()
            c_max = df[col].max()
            if str(col_type)[:3] == 'int':
                if c_min > np.iinfo(np.int8).min and c_max  np.iinfo(np.int16).min and c_max  np.iinfo(np.int32).min and c_max  np.iinfo(np.int64).min and c_max  np.finfo(np.float16).min and c_max  np.finfo(np.float32).min and c_max < np.finfo(np.float32).max:
                    df[col] = df[col].astype(np.float32)
                else:
                    df[col] = df[col].astype(np.float64)
        else:
            df[col] = df[col].astype('category')
            end_mem = df.memory_usage().sum()
            print('Memory usage after optimization is: {:.2f} MB'.format(end_mem))
            print('Decreased by {:.1f}%'.format(100 * (start_mem - end_mem) / start_mem))
            return df
sample_feature = reduce_mem_usage(pd.read_csv('data_for_tree.csv'))
continuous_feature_names = [x for x in sample_feature.columns if x not in ['price','brand','model','brand']]
continuous_feature_names为除了[‘price’,‘brand’,‘model’,‘brand’]四者的数据元素
1.2线性回归 & 五折交叉验证 & 模拟真实业务情况sample_feature = sample_feature.dropna().replace('-',0).reset_index(drop=True)
sample_feature['notRepairedDamage']=sample_feature['notRepairedDamage'].astype(np.float32)
train = sample_feature[continuous_feature_names + ['price']]
train_X = train[continuous_feature_names]
train_y = train['price']
astype()会转化数组的类型,这里将数组的类型转化为32浮点数。
参考链接:【Numpy中ndim、shape、dtype、astype的用法】
train_x和train_y进行区分,用来进行建模查看其他因素和价格之间的关系。
from sklearn.linear_model import LinearRegression
model = LinearRegression(normalize=True)
model = model.fit(train_X, train_y)
'intercept:'+ str(model.intercept_)
a = sorted(dict(zip(continuous_feature_names, model.coef_)).items(), key=lambda x:x[1], reverse=True)
print(a)
from matplotlib import pyplot as plt
subsample_index = np.random.randint(low=0, high=len(train_y), size=50)
plt.scatter(train_X['v_9'][subsample_index], train_y[subsample_index],color='black')
plt.scatter(train_X['v_9'][subsample_index], model.predict(train_X.loc[subsample_index]), color='blue')
plt.xlabel('v_9')
plt.ylabel('price')
plt.legend(['True Price','Predicted Price'],loc='upper right')
print('The predicted price is obvious different from true price')
plt.show()
scatter()
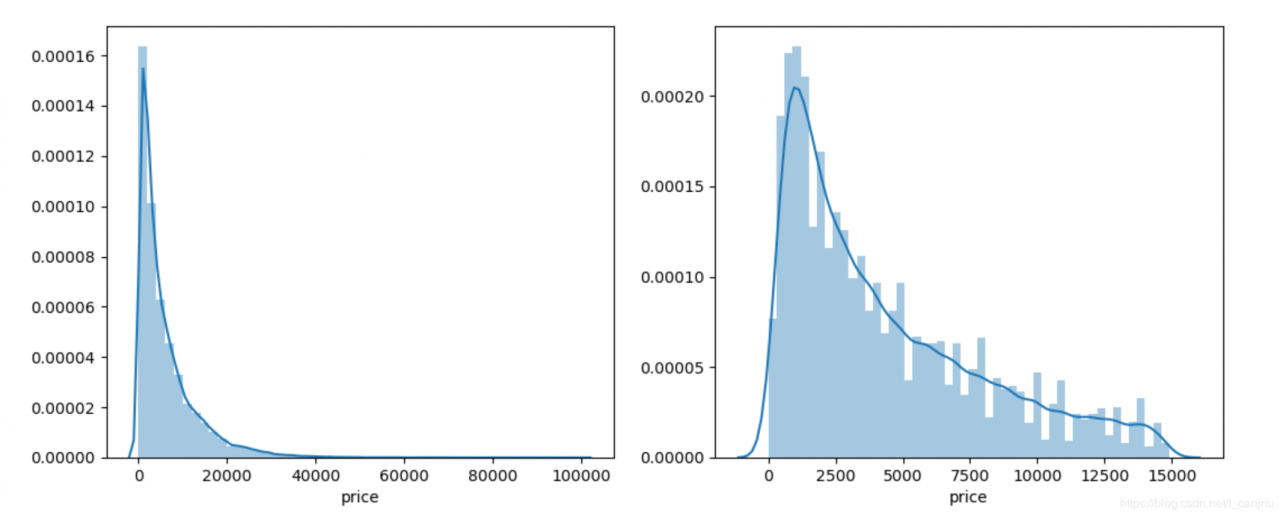
通过作图我们发现数据的标签(price)呈现长尾分布,不利于我们的建模预测。原因是很多模型都假设数据误差项符合正态分布,而长尾分布的数据违背了这一假设。参考博客

import seaborn as sns
print('It is clear to see the price shows a typical exponential distribution')
plt.figure(figsize=(15,5))
plt.subplot(1,2,1)
sns.distplot(train_y)
plt.subplot(1,2,2)
sns.distplot(train_y[train_y < np.quantile(train_y, 0.9)])
subplot(a,b,c)进行画图,构建a*b排列的图,代表显示在第几个图。
核密度估计链接
通常并不会把所有的数据集都拿来训练,而是分出一部分来(这一部分不参加训练)对训练集生成的参数进行测试,相对客观的判断这些参数对训练集之外的数据的符合程度。
K折交叉验证(k-fold cross validation),将初始采样(样本集X,Y)分割成K份,一份被保留作为验证模型的数据(test set),其他K-1份用来训练(train set)。交叉验证重复K次,每份验证一次,平均K次的结果或者使用其它结合方式,最终得到一个单一估测。
交叉验证,总结
3、模型对比 3.1 线性模型 & 嵌入式特征选择 用简单易懂的语言描述「过拟合 overfitting」
模型复杂度与模型的泛化能力
正则化的直观理解
参考机器学习之路一:线性模型、非线性模型、神经网络
4、模型调参 贪心算法 网格调参 贝叶斯调参作者:出门左拐是海
相关文章
Fidelia
2021-05-09
Iris
2021-08-03
Gella
2023-07-20
Kirima
2023-07-20
Grizelda
2023-07-20
Janna
2023-07-20
Fawn
2023-07-21
Ophelia
2023-07-21
Crystal
2023-07-21
Laila
2023-07-21
Aine
2023-07-21
Bliss
2023-07-21
Lillian
2023-07-21
Tertia
2023-07-21
Olive
2023-07-21
Angie
2023-07-21
Nora
2023-07-24