【用pyecharts做地理图】(airbnb租房数据分析)(天池竞赛)
项目介绍
作者:努力学习数据分析的周果昂
项目来源:天池大数据平台
项目思路:针对airbnb中listings表做数据处理,探索分析以及针对经纬度以及价格做地理价格图(pyecharts)
python:3.7.1
pyecharts:1.2.0
(想看图的直接拉到3/4就可)
模块导入#数据处理包导入
import pandas as pd
import numpy as np
from scipy import stats
#画图包导入
import matplotlib.pyplot as plt
import seaborn as sns
#日期处理包导入
import calendar
from datetime import datetime
#jupyter notebook绘图设置
%matplotlib inline
#中文字体正确显示
plt.rcParams['font.sans-serif']=['SimHei']
plt.rcParams['axes.unicode_minus']=False
#警告删除
import warnings
warnings.simplefilter(action="ignore", category=FutureWarning)
warnings.filterwarnings('ignore')
#多行输出
from IPython.core.interactiveshell import InteractiveShell
InteractiveShell.ast_node_interactivity = "all"
# 显示正负号与中文不显示问题
plt.rcParams['axes.unicode_minus'] = False
sns.set_style('darkgrid', {'font.sans-serif':['SimHei', 'Arial']})
数据处理
导入数据
listings = pd.read_csv('listings.csv',parse_dates=['last_review'],dtype={'id':str,'host_id':str})# keep_default_na=False将空值设置为不显示方便之后处理
处理
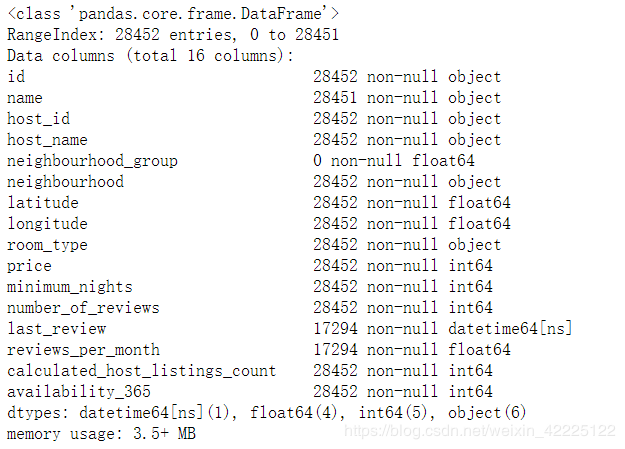
listings.info()
listings.head()
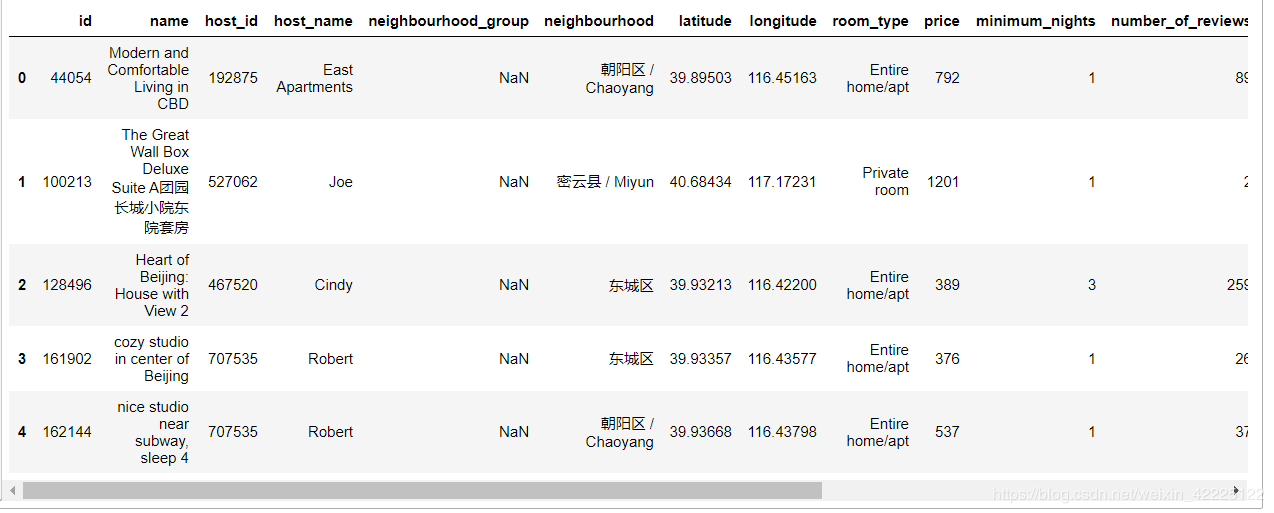
name虽然杂乱有中英文有英文但是不重要不需要处理,host_name中有错乱的数据比如East Apartments也不重要也不需要怎么处理,neighbourhood_group全为空值可以删除这列,neighbourhood可以截取为全中文列
listings.drop(['neighbourhood_group'],axis=1,inplace=True)
listings['neighbourhood'] = listings['neighbourhood'].str.split('/',expand=True)[0]
listings.sample(3)
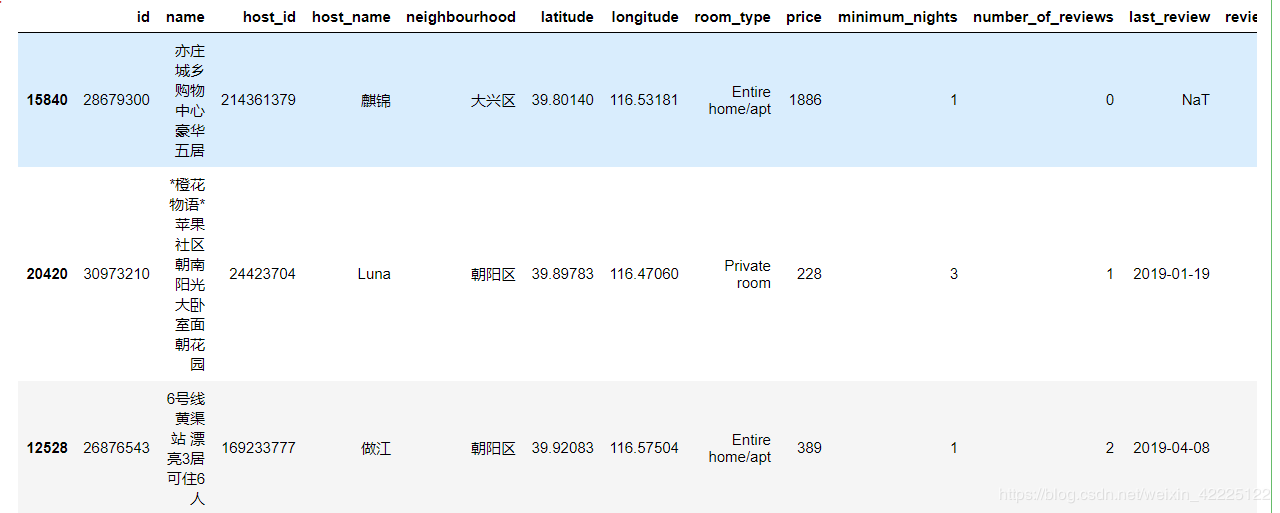
#通过观察,last_review,reviews_per_month和reviews_per_month的空值是一致的
listings[listings['last_review'].isnull()]['number_of_reviews'].sum()
listings[listings['last_review'].isnull()]['reviews_per_month'].sum()
发现结果都是0
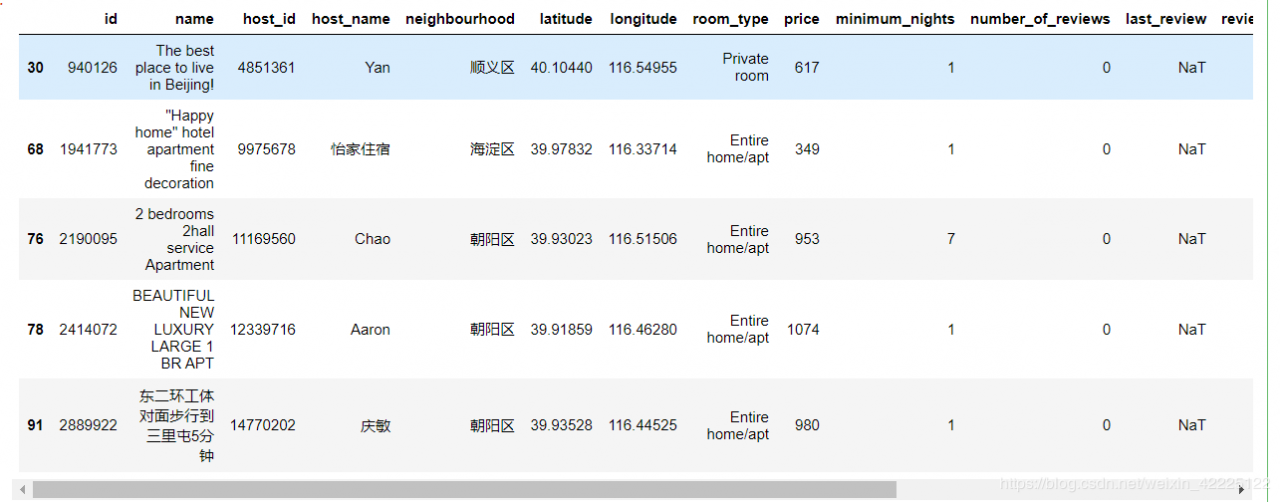
说明这些可能都是未评论房屋,将这些数据的reviews_per_month用0代替
listings.reviews_per_month.fillna(0,inplace=True)
listings[(listings['number_of_reviews']==0)].head()
listings.describe()

price,minimum_nights,number_of_reviews和calculated_host_listings_count等有异常值
首先看price
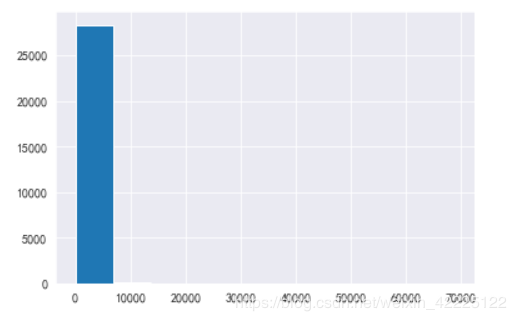
#通过直方图直观看出大部分价格在10000以内
listings.price.hist()
#缩小范围后再次查看直方图
listings_price1000 = listings.loc[listings['price']<1000]
listings_price1000.price.hist()
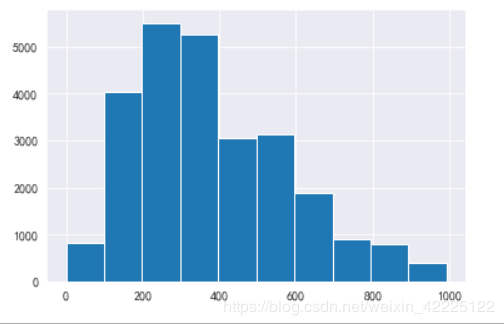
发现大部分房屋价格在200到700之间一晚,1000以上的异常值可能较多,比较符合常理,因为airbnb本来的品牌理念就是实现空闲房屋的共享使用,大部分提供的房屋都是普通型,价格过高的不会太多
#异常值查看
listings.loc[listings['price']==68983]

#异常值查看
listings.loc[listings['price']==0]
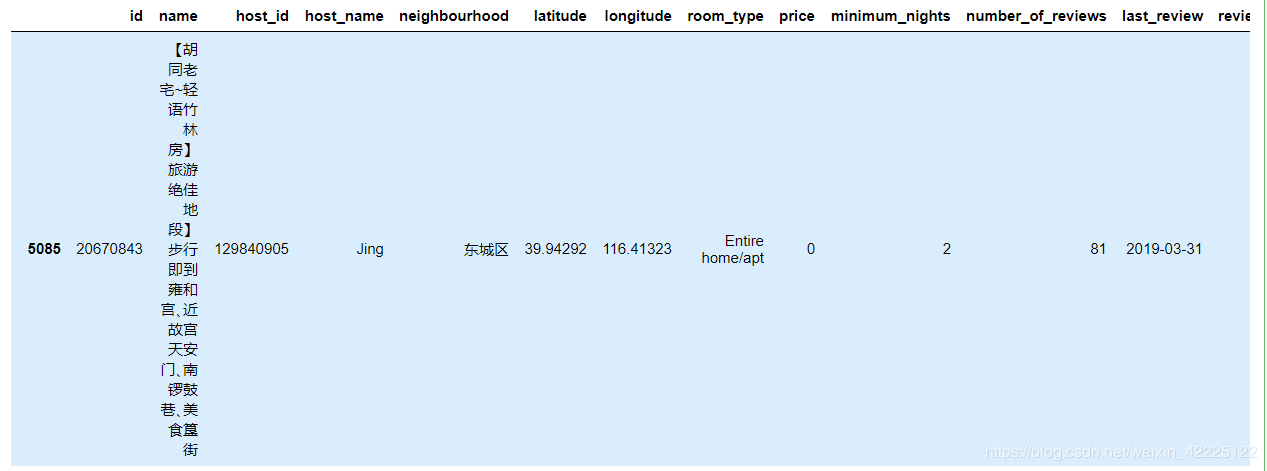
结论是:
区域化分析
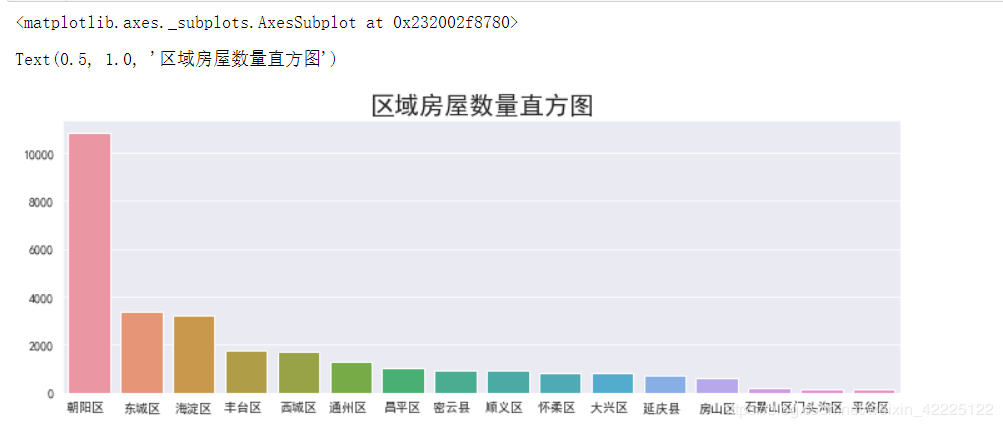
#区域房屋数量
listings['neighbourhood'].value_counts()
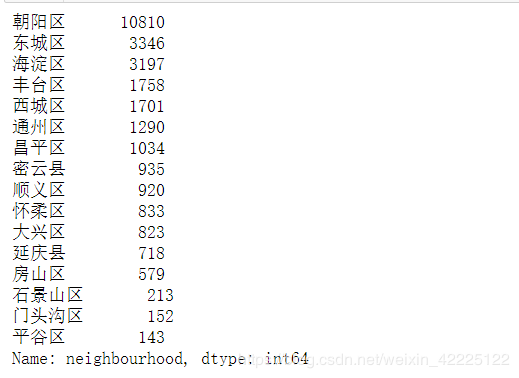
fig = plt.figure(figsize=(12,4))
sns.barplot(listings['neighbourhood'].value_counts().index,listings['neighbourhood'].value_counts().values,data = listings)
plt.title('区域房屋数量直方图',fontsize=20)
价格分析
#全北京房屋平均每晚房价是多少
listings.price.mean()  #所有房屋
listings_price1000.price.mean()   #价格小于1000的房屋
611.2033248980739
381.6178138595401
安装与导入地图包
pip install echarts-countries-pypkg  -i https://mirrors.aliyun.com/pypi/simple# 全球国家地图
pip install echarts-cities-pypkg    -i https://mirrors.aliyun.com/pypi/simple# 全球城市地图
pip install echarts-china-provinces-pypkg  -i https://mirrors.aliyun.com/pypi/simple# 中国省级地图
pip install echarts-china-cities-pypkg  -i https://mirrors.aliyun.com/pypi/simple# 中国市级地图
pip install echarts-china-misc-pypkg -i https://mirrors.aliyun.com/pypi/simple # 中国区域地图
pip install echarts-united-kingdom-pypkg -i https://mirrors.aliyun.com/pypi/simple # 英国选区图可以用来画与政治经济相关的数据
数据预处理
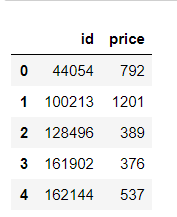
data = pd.DataFrame(listings,columns=['id','price'])
data.head()
data_pair = []
for i in range(len(listings)):
    data_pair.append((data.iloc[i][0],int(data.iloc[i][1])))  #pyecharts是不支持numpy.int的
#导入地图库
from pyecharts.charts import Geo
from pyecharts import options as opts
from pyecharts.globals import GeoType
def test_geo():
    city = '北京'
    g = Geo()
    g.add_schema(maptype=city)
    # 定义坐标对应的名称,添加到坐标库中 add_coordinate(name, lng, lat)
    for i in range(len(data_pair)):
        g.add_coordinate(listings['id'][i],listings['longitude'][i],listings['latitude'][i])
    # 定义数据对
    g.add('', data_pair, type_=GeoType.EFFECT_SCATTER, symbol_size=5)
    # 设置样式
    g.set_series_opts(label_opts=opts.LabelOpts(is_show=False))
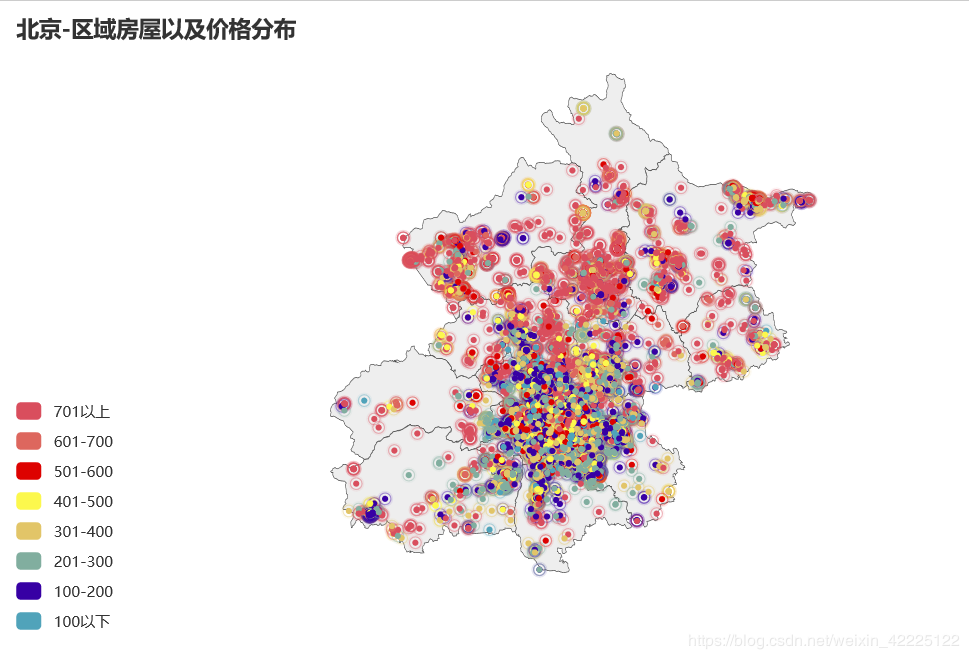
    # 自定义分段 color 可以用取色器取色
    pieces = [
        {'max': 100, 'label': '100以下', 'color': '#50A3BA'},
        {'min': 101, 'max': 200, 'label': '100-200', 'color': '#3700A4'},
        {'min': 201, 'max': 300, 'label': '201-300', 'color': '#81AE9F'},
        {'min': 301, 'max': 400, 'label': '301-400', 'color': '#E2C568'},
        {'min': 401, 'max': 500, 'label': '401-500', 'color': '#FCF84D'},
        {'min': 501, 'max': 600, 'label': '501-600', 'color': '#DD0200'},
        {'min': 601, 'max': 700, 'label': '601-700', 'color': '#DD675E'},
        {'min': 701, 'label': '701以上', 'color': '#D94E5D'}  # 有下限无上限
    ]
    #  is_piecewise 是否自定义分段, 变为true 才能生效
    g.set_global_opts(
        visualmap_opts=opts.VisualMapOpts(is_piecewise=True, pieces=pieces),
        title_opts=opts.TitleOpts(title="{}-区域房屋以及价格分布".format(city)),
    )
    return g
g = test_geo()
g.render('test_render3.html')
全价格分析
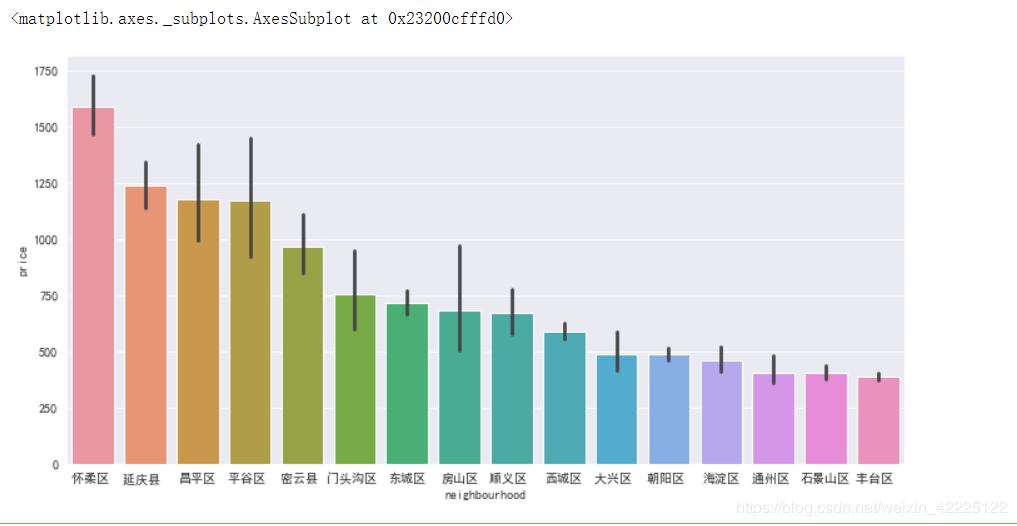
listings_gbneigh=listings.groupby(by='neighbourhood')
listings_gbneigh.price.mean().sort_values(ascending=False)
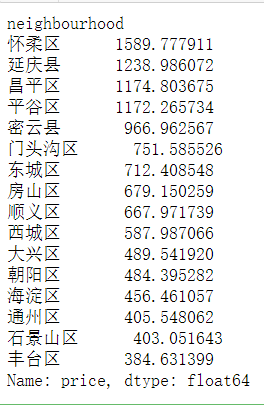
fig = plt.figure(figsize=(12,6))
sns.barplot(x=listings.neighbourhood,y=listings.price,data=listings,order=listings_gbneigh.price.mean().sort_values(ascending=False).index)
1000以内价格分析
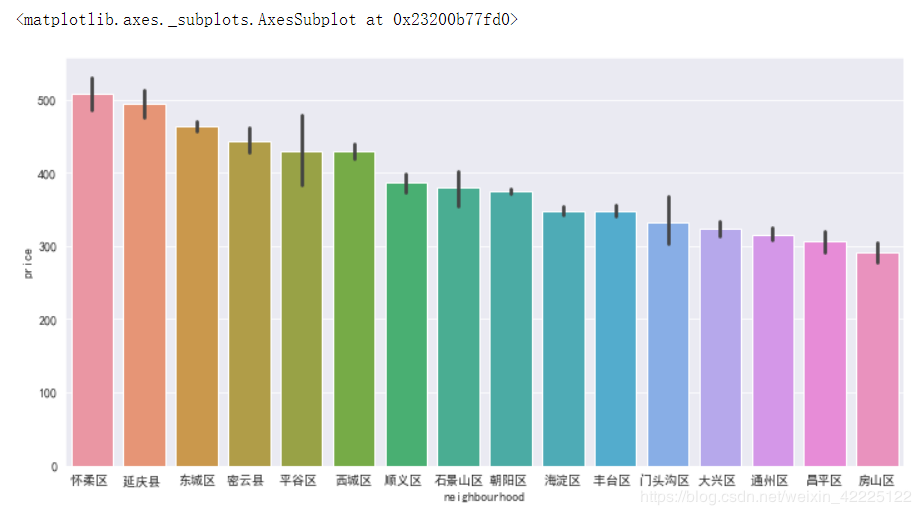
listings_gbneigh1000=listings_price1000.groupby(by='neighbourhood')
listings_gbneigh1000.price.mean().sort_values(ascending=False)
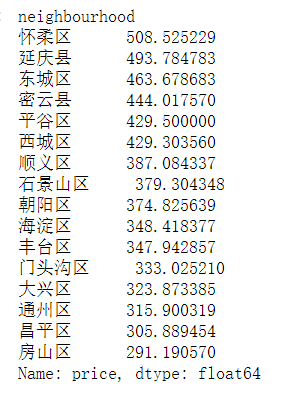
fig = plt.figure(figsize=(12,6))
sns.barplot(x=listings_price1000.neighbourhood,y=listings_price1000.price,data=listings_price1000,order=listings_gbneigh1000.price.mean().sort_values(ascending=False).index)
fig,axes = plt.subplots(1,3,figsize=(12,3))
sns.distplot(listings_price1000[listings_price1000.room_type=='Entire home/apt'].price,ax=axes[0],axlabel='Entire home/apt')
sns.distplot(listings_price1000[listings_price1000.room_type=='Private room'].price,ax=axes[1],axlabel='Private room',color='r')
sns.distplot(listings_price1000[listings_price1000.room_type=='Shared room'].price,ax=axes[2],axlabel='Shared room',color='green')

查看房源数量和房东人数的关系
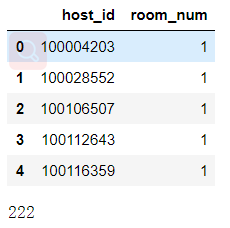
#以host_id分组
df1=listings.groupby('host_id').count()['id'].to_frame() #以host_id分组,并计算每位房东的房屋数,转换为DT
df1['host_id'] = df1.index #将index转换为列
df1.reset_index(drop=True,inplace=True)
df1.rename(columns={'id':'room_num'},inplace=True)
df1 = pd.DataFrame(df1,columns=['host_id','room_num'])
print('以host_id分组:')
df1.head()
df1.room_num.max() #查看拥有最多房屋的房东的房屋数
以host_id分组:
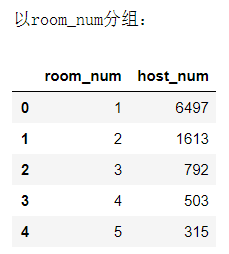
#以room_num分组
df2=df1.groupby('room_num').count()['host_id'].to_frame() #以room_num分组,并计算拥有固定房屋数的房东数有多少,转换为DT
df2['room_num']=df2.index
df2.reset_index(drop=True,inplace=True)
df2=pd.DataFrame(df2,columns=['room_num','host_id'])
df2.rename(columns={'host_id':'host_num'},inplace=True)
print('以room_num分组:')
df2.head()
df2 = df2.sort_values(by='room_num',ascending=False)
df2.reset_index(drop=True,inplace=True)
df2['room_num_all']=df2['room_num']*df2['host_num']
df2['room_percentage'] = df2['room_num_all'].cumsum()/df2['room_num_all'].sum()*100
df2['host_percentage'] = df2['host_num'].cumsum()/df2['host_num'].sum()*100
df2.tail()
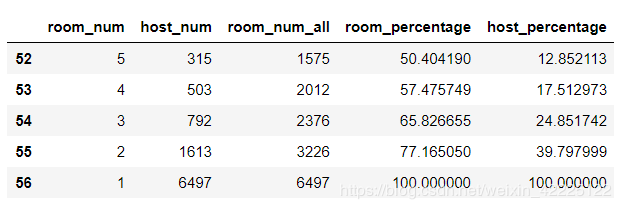
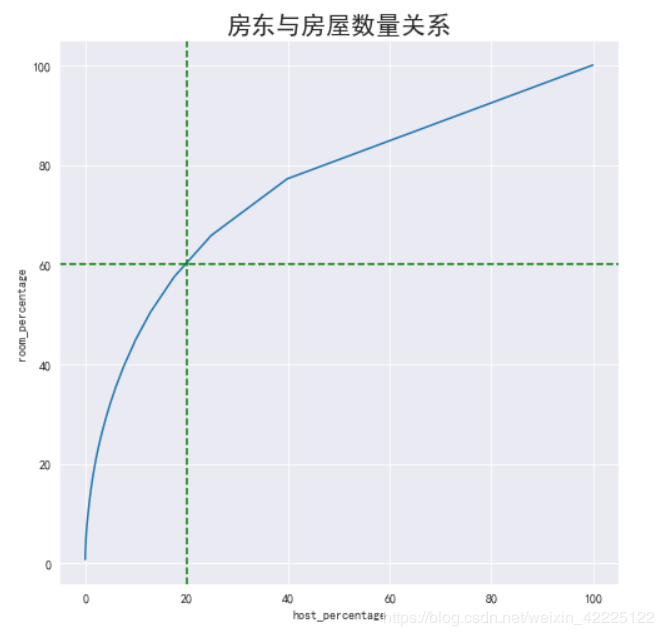
fig = plt.figure(figsize=(8,8))
ax = sns.lineplot(df2.host_percentage,df2.room_percentage)
ax.axvline(x=20,ls="--",c="green")#添加垂直直线
ax.axhline(y=60,ls="--",c="green")#添加垂直直线
ax.set_title(label='房东与房屋数量关系',fontsize=20)
数据分析刚入门,各位巨佬手下留情
作者:努力学习数据分析的周果昂
相关文章
Alexandra
2020-05-29
Kaitlyn
2021-06-05
Rachel
2023-07-20
Psyche
2023-07-20
Winola
2023-07-20
Gella
2023-07-20
Grizelda
2023-07-20
Janna
2023-07-20
Ophelia
2023-07-21
Crystal
2023-07-21
Laila
2023-07-21
Aine
2023-07-21
Bliss
2023-07-21
Lillian
2023-07-21
Tertia
2023-07-21
Olive
2023-07-21
Angie
2023-07-21