(二)爬取新房销售信息——数据分析+可视化篇
上一个任务通过requests、BeautifulSoup4两个功能强大、用法简洁的函数库已经获取到了楼盘名、地址和价格这些新房信息,并且保存为csv格式文件,csv文件可以用excel打开并进行编辑。
当然爬取数据只是第一步,“白嫖”网站辛苦整理的数据毕竟不太合适,所以这些数据如何产生价值呢?
设置一个场景:
当你想要在一座城市买房,在去各个售楼部踩点之前要做一些准备工作。
现在新房的信息已经收集完了,excel可以很快得出在售楼盘的数量、房价最高和最低,利用手机中的地图app可以很快搜索到楼盘的位置,不过一个一个搜索还是比较麻烦,当数据量很大时对于excel的工作量也会增大。
最关键的是,如果你想了解不同城市的新房情况,每爬虫一次都是新的数据,如何利用python工具来进行自动化的分析呢?
这次的任务是:对采集的新房数据进行分析,包括不限于数量、最大值、最小值、均值、分布等,并通过图表可视化,使数据呈现更加直观。
函数库准备首先需要导入此次任务用到的函数库:pandas、matplotlib.pyplot,如何装载可以参考我第一篇博客。
import pandas as pd
import matplotlib.pyplot as plt
这里要特别介绍一下pandas,pandas库的数据基本类型为Series(序列),是类似一维数组的对象,由数据和索引组成,索引在左(从0开始),数据在右,索引自动创建。
当然用得比较多的是类似于excel的DataFrame(表),是由多条序列组成的一个数据表,每个序列是数据表的一列,共用一个从0开始的索引,示例见下图:
data = {
    'city':['Beijing','Beijing','Shanghai','Shanghai','Shenzhen','Shenzhen','Guangzhou','Guangzhou'],
    'year':[2018,2019,2018,2019,2018,2019,2018,2019],
    'index':[2,2.1,1.6,1.8,2.3,1.9,1.8,1.7]}
frame = pd.DataFrame(data)
frame
生成结果如下:
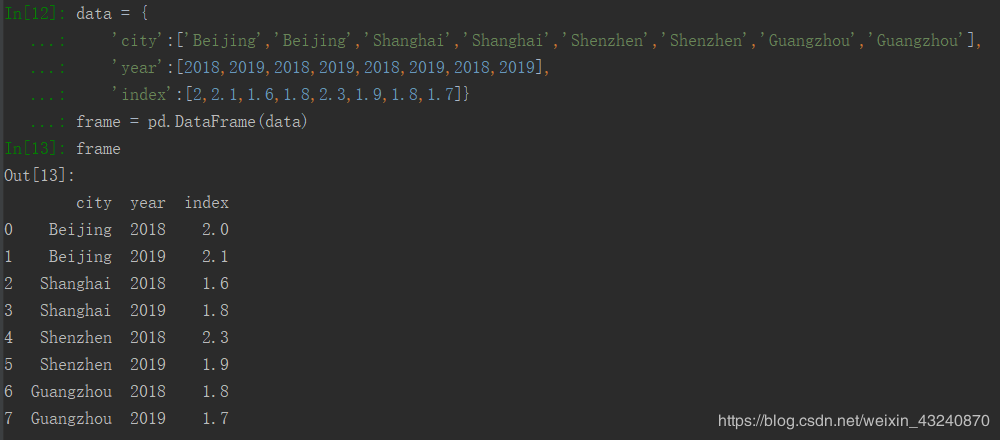
DataFrame可以通过上图字典的方式进行创建,也可以读取csv、json或者xlsx文件(excel)得到,本篇的实操部分就通过上一次保存的csv文件得到dataframe表用于数据分析。
(当然上一篇提到的使用pandas的DataFrame功能把爬取到的数据生成csv文件会在后文进行补充,从爬取文件到创建dataframe表到数据分析到可视化一气呵成的代码会放在文章最后)
在做数据分析之前首先要检查爬取到的数据是否可以直接进行数学运算、排序等操作,通过excel格式打开csv文件会更直观、且符合看表习惯。
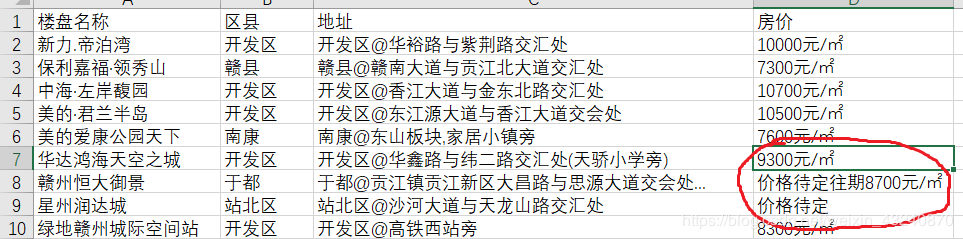
图中画红圈的部分有具体价格、价格待定但有往期价格和价格待定三种情况,首先不管三七二十一,先对三种情况分别统计数量。
‘价格待定’的楼盘因为缺失价格信息没有办法对价格进行比较,所以用于数据分析的数据中要把“价格待定”的数据删除,只对有具体价格的楼盘进行比较。
为此,我在第一次爬虫代码的基础上做了一点优化:
(1) 分三种情况进行统计;
(2) 并用pandas保存csv代码;
(3) 为了不使代码看起来臃肿,定义了函数优化结构。
优化后的代码如下,直接复制使用即可。
"""
作者:Michel
功能:获取房地产价格数据
版本:3.0
日期:2020/3/14
2.0增加功能:实时获取房产信息,不需要手动补充信息
3.0增加功能:(1)区分有具体价格、价格待定但有往期价格和价格待定三种情况,分别统计;同时增加district变量表示区县
(2)pandas创建dataframe,保存为csv文件
(3)定义函数,使代码更加简洁
"""
import requests as re
from bs4 import BeautifulSoup
import pandas as pd
# 定义一个用pandas写入csv文件的函数
def dateframe_to_csv(list):
"""
用pandas创建DateFrame,然后写入csv文件
"""
name_list = []
district_list = []
address_list = []
price_list = []
for line in list:
if list.index(line) % 2 == 0:
name_list.append(line[0])
district_list.append(line[1])
address_list.append(line[2])
else:
price_list.append(line)
newhouse_dict = {'楼盘名': name_list, '区县': district_list, '地址': address_list, '价格': price_list}
df = pd.DataFrame(newhouse_dict)
df.to_csv('ganzhou_newhouse_current_price.csv', index=False, mode='w', encoding='GBK')
return df
def main():
"""
主函数
"""
# 初始化有具体价格、往期价格、价格暂定的三个列表
have_cur_price_list = [] # 楼盘有实时价格
have_pre_price_list = [] # 楼盘有往期价格
have_no_price_list = [] # 楼盘价格待定,且无往期价格供参考
# 分别统计数量,完成爬取后输出信息
is_cur_price_num = 0 # 有实时价格的的楼盘数量
is_pre_price_num = 0 # 无实时但有往期价格的楼盘数量
is_no_price_num = 0 # 价格待定的楼盘数量
# 爬取数据
for i in range(1, 10):
url = "http://ganzhou.newhouse.fang.com/house/s/b9"+str(i)+"/"
html = re.get(url, timeout=30)
html.encoding = 'GBK' # 解决中文乱码问题
soup = BeautifulSoup(html.text, 'lxml')
nlc_details = soup.find_all('div',class_='nlc_details')
for detail in nlc_details:
str_detail = str(detail)
#保证price有具体值,可以实时获取
if str_detail.find('元/㎡') != -1: # 在字符串中查找子字符串,如果找到返回索引值,如果找不到返回-1
if str_detail.find('价格待定') == -1:
name = detail.find('div',{'class':'nlcd_name'}).text.strip()
#为便于后面分组统计,把地址信息再拆分为”区县”+“详细地址”两条信息,定义一个新变量district接收区县数据
address = detail.find('div',{'class':'address'}).text.strip().replace('\t','').replace('[','').replace(']','@')
list = address.split('@')
district = list[0]
have_cur_price_list.append([name, district, address])
Price = detail.find('div', {'class': 'nhouse_price'})
for price in Price.select('span'):
have_cur_price_list.append(price.get_text())
is_cur_price_num += 1
if is_cur_price_num % 10 == 0:
print('已获取有实时价格的数据{}条'.format(is_cur_price_num))
else:
price = detail.find('div',{'class':'nhouse_price'}).text.strip()
name = detail.find('div',{'class':'nlcd_name'}).text.strip()
address = detail.find('div',{'class':'address'}).text.strip().replace('\t','').replace('[','').replace(']','@')
list = address.split('@')
district = list[0]
have_pre_price_list.append([name, district, address, price])
is_pre_price_num += 1
else:
price = detail.find('div',{'class':'nhouse_price'}).text.strip()
name = detail.find('div',{'class':'nlcd_name'}).text.strip()
address = detail.find('div',{'class':'address'}).text.strip().replace('\t','').replace('[','').replace(']','@')
list = address.split('@')
district = list[0]
have_no_price_list.append([name, district, address, price])
is_no_price_num += 1
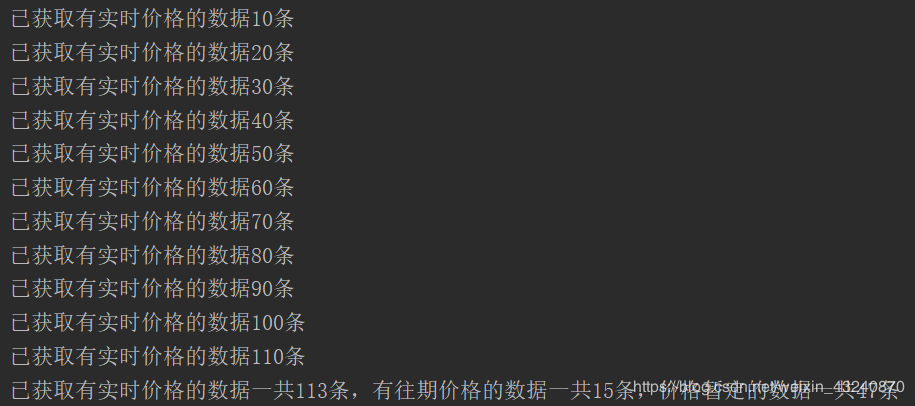
# 输出爬取信息的统计结果
print('已获取有实时价格的数据一共{}条,有往期价格的数据一共{}条,价格暂定的数据一共{}条'.format(is_cur_price_num,is_pre_price_num,is_no_price_num))
# 调用dateframe_to_csv函数
newhouse_price_data = dateframe_to_csv(have_cur_price_list)
print(newhouse_price_data)
if __name__ == '__main__':
main()
输出结果为:
优化后的代码最终保存的文件是一个只包括具体价格的表,需要和原来的文件做一个区分,保存为**‘ganzhou_newhouse_current_price.csv’**(后面直接使用该表做数据分析)。
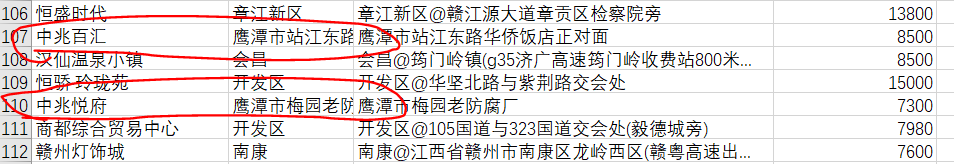
上图红圈处,鹰潭市明显不属于赣州市,这两行数据要删去,可以在excel很便捷地处理,当然也可以用python中DataFrame的数据清洗进行处理。(我当然选excel!多方便是不是?)
好吧,为了照顾到这篇文章的纯洁性,所有操作基本都在python中进行,在实操部分会有介绍dataframe清洗数据。
因为这次任务希望输出图表,图表中含有中文字符,也有可能会有负数,所以先写入下列两行代码防止输出时出现乱码:
(固定写法,使用matplotlib.pyplot时直接复制。第一行表示plt包输出的图表字体转为‘黑体’)
plt.rcParams['font.sans-serif'] = ['SimHei']    #可输出中文
plt.rcParams['axes.unicode_minus'] = False      #可处理负数
第一步:读取文件
用pandas中的read_csv()函数读取先前保存的‘ganzhou_newhouse_current_price.csv’文件,读取的内容自动生成类型为,赋值给变量‘newhouse_price_data’
newhouse_price_data = pd.read_csv('ganzhou_newhouse_current_price.csv',encoding='GBK') # 注意read_csv()里的encoding参数默认值为“utf-8”,因为我们保存csv文件时encoding为‘GBK’,所以要特别设置encoding。
第二步:数据清洗
因为数据中混入了两个鹰潭市的奇怪数据,不在我的考虑范围,需要通过DataFrame的drop()函数删去:
newhouse_price_data.drop([105, 108],axis=0,inplace=True) # 105、108是鹰潭市数据的索引值,通过索引值可以快速定位到指定行并执行删除操作;inplace代表是否真正删去,True会改变原来的newhouse_price_data。
第三步:基本统计
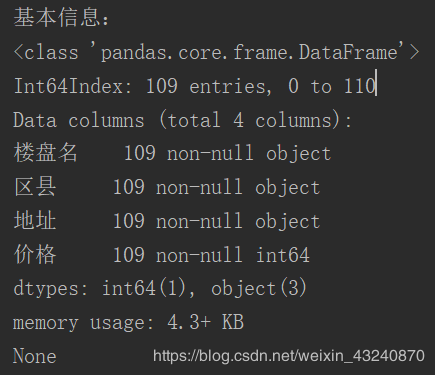
可以用dataframe.info()查看基本信息:print('基本信息:')
print(newhouse_price_data.info())
输出结果如下:newhouse_price_data的类型、索引值范围、列信息、值类型、占用内存空间,其中可以看到一共有109行数据,其中1列为整数型(价格),三列为object类型(类似字符型)
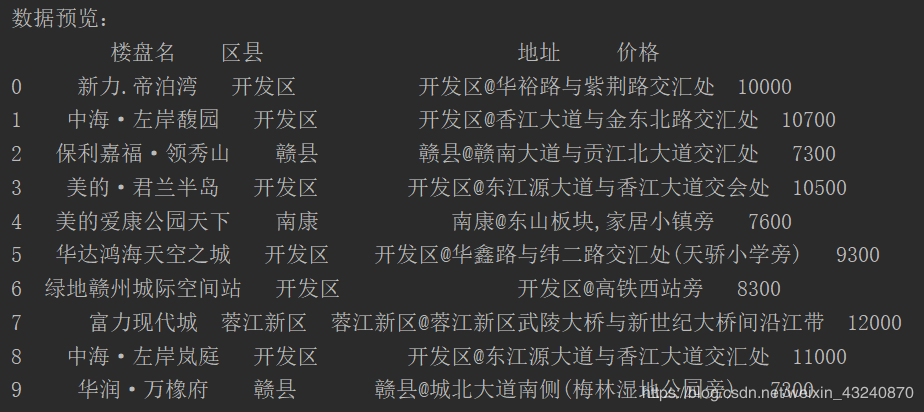
2. 用dataframe.head(n)预览前n行和dataframe.tail(n)预览后n行:
print('数据预览:')
print(newhouse_price_data.head(10)) # head(n)表示预览前n行,同理,tail(n)表示后n行
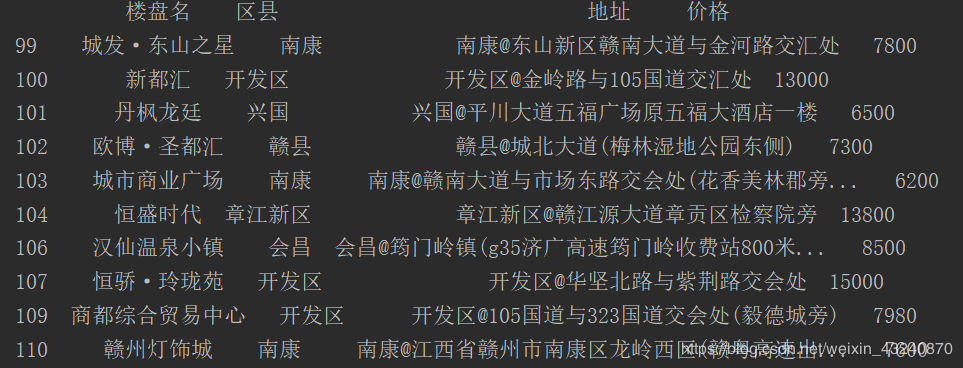
print(newhouse_price_data.tail(10)) # head(n)表示预览前n行,同理,tail(n)表示后n行
输出结果如下:
前10行
后10行
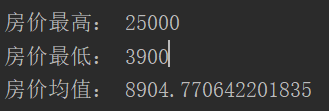
3. max()、min()、mean()、median()分别得到(数字型数据的)最大值、最小值、平均值和中位值,count()可以得到某一列的个数。
print('房价最高:', newhouse_price_data['价格'].max()) #价格列的最大值
print('房价最低:', newhouse_price_data['价格'].min()) #价格列的最小值
print('房价均值:', newhouse_price_data['价格'].mean()) #价格列的平均值
输出结果为:
第四步:排序、分组
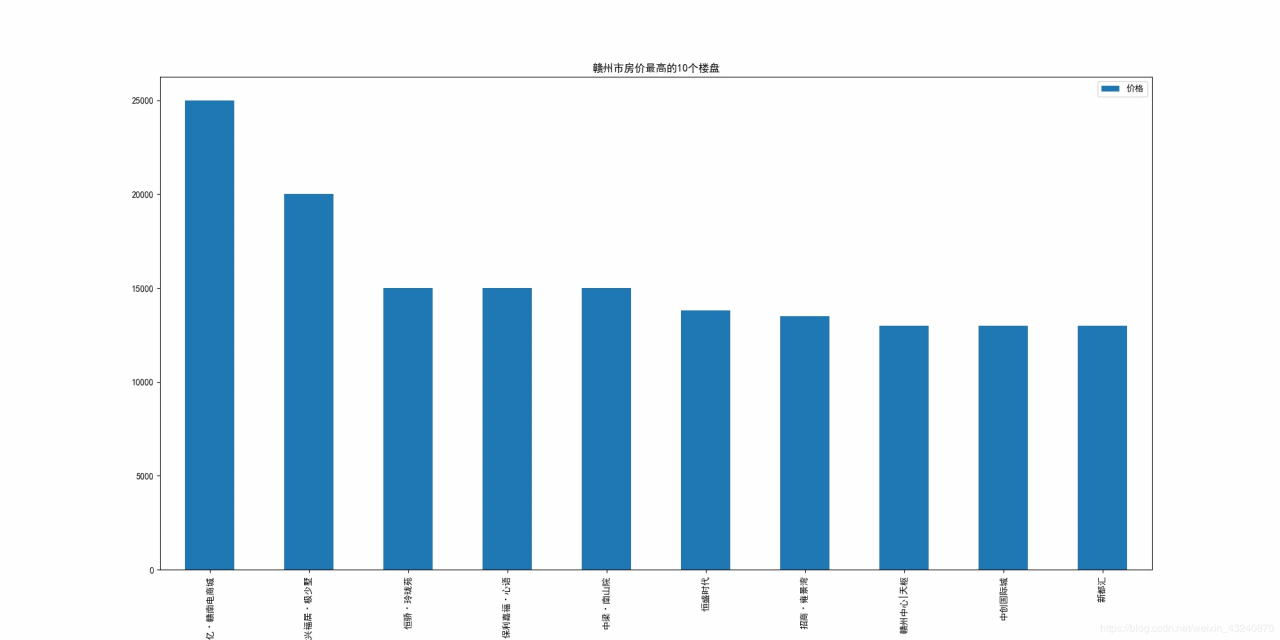
这里用sort_values()按‘价格’进行降序排序,并取价格top20,同时可视化输出柱状图
#房价top20
top10_communities = newhouse_price_data.sort_values(by = ['价格'],ascending= False).head(10) #dataframe.sort_values(by=[],ascending=[]),by参数表示按哪一列的值排序,ascending参数默认值为True,即升序,这里是降序排序,所以要设置参数为'False',head()见上。
top10_communities.plot(kind = 'bar',x ='楼盘名' ,y ='价格',title = '赣州市房价最高的10个楼盘' ,figsize = (20,10)) #pandas的dataframe可以直接调用matplotlib的plot函数,kind参数表示图表类型,bar是柱状图,x、y轴设置为列名使用该列的值,title表示图表标题,figsize表示图表尺寸大小。
plt.savefig('top10_communities_bar.jpg') #plt.savefig()函数直接把上一条语句生成的plot图表进行保存,括号中写入filepath
得到柱状图如下:
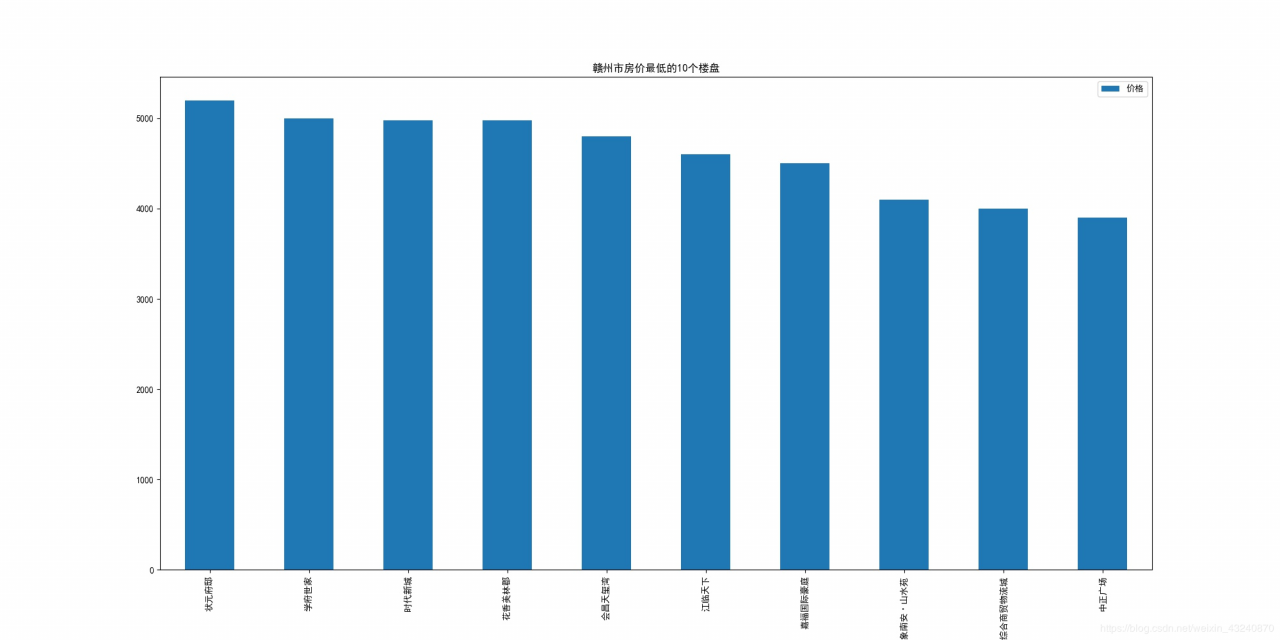
同理可以得到价格battom20,输出柱状图并保存,如下:
#房价bottom20
bottom10_communities = newhouse_price_data.sort_values(by = ['价格'],ascending= False).tail(10) #注释见上,tail()注释见数据预览部分
bottom10_communities.plot(kind = 'bar',x ='楼盘名' ,y ='价格',title = '赣州市房价最低的10个楼盘' ,figsize = (20,10))
plt.savefig('bottom10_communities_bar.jpg')
得到柱状图如下:
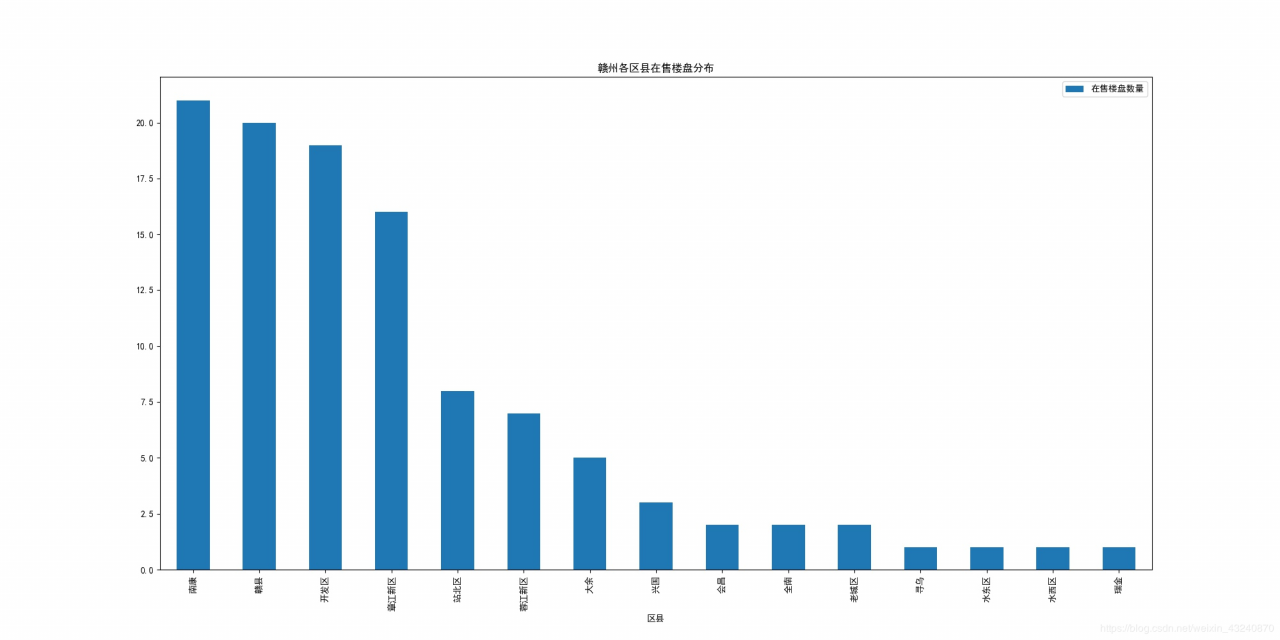
2. groupby()进行分组
优化的代码中已经把每一个楼盘所属区县的信息也做了统计,在newhouse_price_data中的列为’district’
这里按区县分组统计楼盘数量.
group_by_district_num_data = newhouse_price_data['楼盘名'].groupby(newhouse_price_data['区县']).count()
# 因为group_by_district_num_data的类型为pandas的series,所以需要先转换为dict,再转换成dataframe类型再用pandas画图
group_by_district_num = pd.DataFrame({'区县': group_by_district_num_data.index, '在售楼盘数量': group_by_district_num_data.values})
group_by_district_num.sort_values(by='在售楼盘数量', ascending=False).plot(kind='bar', x='区县', y='在售楼盘数量',
title='赣州各区县在售楼盘分布', figsize=(20, 10))
plt.savefig('district_group_num_bar.jpg')
得到图表为:
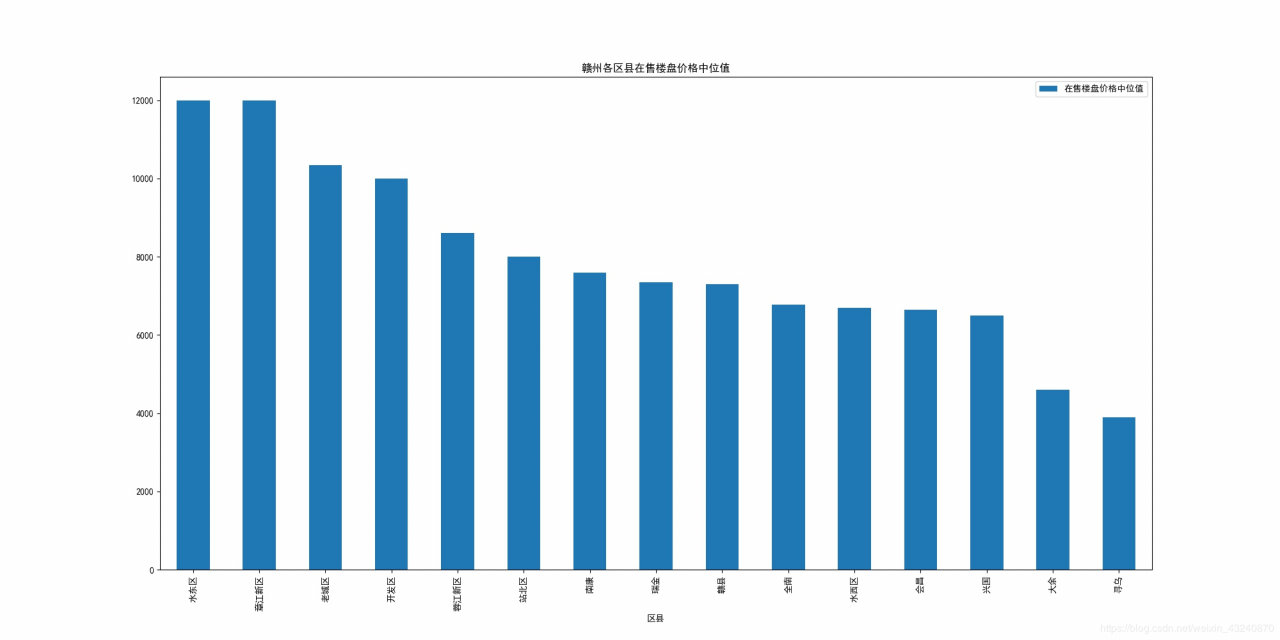
同理,可以按区县分组统计楼盘价格的中位值:
group_by_district_price_data = newhouse_price_data['价格'].groupby(newhouse_price_data['区县']).median()
print(group_by_district_price_data)
# 因为group_by_district_price_data的类型为pandas的series,所以需要先转换为dict,再转换成dataframe类型再用pandas画图
group_by_district_price_median = pd.DataFrame({'区县': group_by_district_price_data.index, '在售楼盘价格中位值': group_by_district_price_data.values})
group_by_district_price_median.sort_values(by='在售楼盘价格中位值', ascending=False).plot(kind='bar', x='区县', y='在售楼盘价格中位值',
title='赣州各区县在售楼盘价格中位值', figsize=(20, 10))
plt.savefig('district_group_price_median_bar.jpg')
得到图表为:
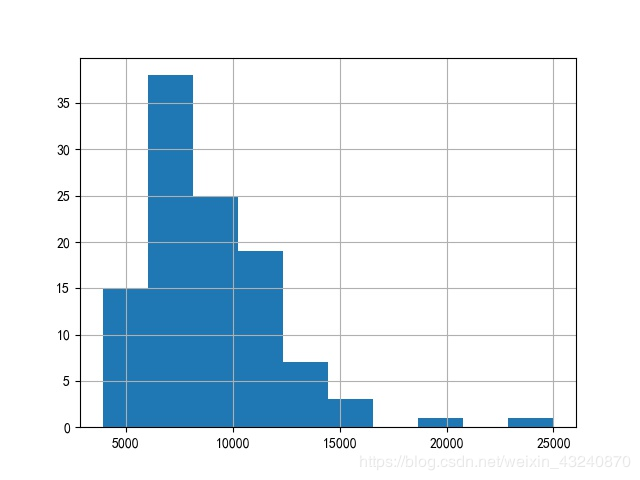
第五步:输出直方图
hist()函数,按照价格数据绘制价格分布直方图
# 绘制价格分布直方图
newhouse_price_data['价格'].hist().get_figure().savefig('price_hist.jpg')
图表如下:
当然,如果想即时看到图表的话,只要在plot语句后写入下面这行就可以直接看到图表:
#保存csv文件
top10_communities.to_csv('top10_communities.csv',index = False)
bottom10_communities.to_csv('bottom10_communities.csv',index = False)
group_by_district.to_csv('real_state_in_district.csv',index = False)
to_csv()函数也能很方便地保存分析过后的数据结果:
#保存csv文件
top10_communities.to_csv('top10_communities.csv',index = False)
bottom10_communities.to_csv('bottom10_communities.csv',index = False)
group_by_district.to_csv('real_state_in_district.csv',index = False)
文章的最后是从爬取文件到创建dataframe表到数据分析到可视化一气呵成的所有代码:
"""
作者:Michel
功能:获取房地产价格数据
版本:3.3
日期:2020/3/14
2.0增加功能:实时获取房产信息,不需要手动补充信息
3.0增加功能:区分有具体价格、价格待定但有往期价格和价格待定三种情况,分别统计。
3.1增加功能:优化代码,结构化
3.2增加功能:使用pandas进行数据分析
3.3增加功能:从爬取文件到创建dataframe表到数据分析到可视化一气呵成,整合代码(代码有点长,后面会再简化)
"""
import requests as re
from bs4 import BeautifulSoup
import pandas as pd
import matplotlib.pyplot as plt
# 定义一个用pandas写入csv文件的函数
def dateframe_to_csv(list):
"""
用pandas创建DateFrame,然后写入csv文件
"""
name_list = []
district_list = []
address_list = []
price_list = []
for line in list:
if list.index(line) % 2 == 0:
name_list.append(line[0])
district_list.append(line[1])
address_list.append(line[2])
else:
price_list.append(line)
newhouse_dict = {'楼盘名': name_list, '区县': district_list, '地址': address_list, '价格': price_list}
df = pd.DataFrame(newhouse_dict)
df.to_csv('ganzhou_newhouse_current_price.csv', index=False, mode='w', encoding='GBK')
return df
def main():
"""
主函数
"""
have_cur_price_list = [] # 楼盘有实时价格
have_pre_price_list = [] # 楼盘有往期价格
have_no_price_list = [] # 楼盘价格待定,且无往期价格供参考
# 分别统计数量,完成爬取后输出信息
is_cur_price_num = 0 # 有实时价格的的楼盘数量
is_pre_price_num = 0 # 无实时但有往期价格的楼盘数量
is_no_price_num = 0 # 价格待定的楼盘数量
# 爬取数据
for i in range(1, 10):
url = "http://ganzhou.newhouse.fang.com/house/s/b9"+str(i)+"/"
html = re.get(url, timeout=30)
html.encoding = 'GBK' # 解决中文乱码问题
soup = BeautifulSoup(html.text, 'lxml')
nlc_details = soup.find_all('div',class_='nlc_details')
for detail in nlc_details:
str_detail = str(detail)
#保证price有具体值,可以实时获取
if str_detail.find('元/㎡') != -1: # 在字符串中查找子字符串,如果找到返回索引值,如果找不到返回-1
if str_detail.find('价格待定') == -1:
name = detail.find('div',{'class':'nlcd_name'}).text.strip()
address = detail.find('div',{'class':'address'}).text.strip().replace('\t','').replace('[','').replace(']','@')
list = address.split('@')
district = list[0]
have_cur_price_list.append([name, district, address])
Price = detail.find('div', {'class': 'nhouse_price'})
for price in Price.select('span'):
have_cur_price_list.append(price.get_text())
is_cur_price_num += 1
if is_cur_price_num % 10 == 0:
print('已获取有实时价格的数据{}条'.format(is_cur_price_num))
else:
price = detail.find('div',{'class':'nhouse_price'}).text.strip()
name = detail.find('div',{'class':'nlcd_name'}).text.strip()
address = detail.find('div',{'class':'address'}).text.strip().replace('\t','').replace('[','').replace(']','@')
list = address.split('@')
district = list[0]
have_pre_price_list.append([name, district, address, price])
is_pre_price_num += 1
else:
price = detail.find('div',{'class':'nhouse_price'}).text.strip()
name = detail.find('div',{'class':'nlcd_name'}).text.strip()
address = detail.find('div',{'class':'address'}).text.strip().replace('\t','').replace('[','').replace(']','@')
list = address.split('@')
district = list[0]
have_no_price_list.append([name, district, address, price])
is_no_price_num += 1
# 输出爬取信息的统计结果
print('已获取有实时价格的数据一共{}条,有往期价格的数据一共{}条,价格暂定的数据一共{}条'.format(is_cur_price_num,is_pre_price_num,is_no_price_num))
# 调用dateframe_to_csv函数
newhouse_price_data = dateframe_to_csv(have_cur_price_list)
"""
从这里开始进入到数据分析部分
"""
# 数据清洗,表里混入了两个鹰潭市的数据,通过drop删去
newhouse_price_data.drop([105, 108], axis=0, inplace=True) # inplace代表是否真正删去
print('基本信息:')
print(newhouse_price_data.info())
print('*' * 30, '\n')
# 基本统计
print('数据预览:')
print(newhouse_price_data.head(10))              # head(n)表示预览前n行,同理,tail(n)表示后n行
print(newhouse_price_data.tail(10))              # head(n)表示预览前n行,同理,tail(n)表示后n行
print('*' * 30, '\n')
print('房价最高:', newhouse_price_data['价格'].max())
print('房价最低:', newhouse_price_data['价格'].min())
print('房价均值:', newhouse_price_data['价格'].mean())
print('*' * 30, '\n')
# 绘制价格分布直方图
newhouse_price_data['价格'].hist().get_figure().savefig('price_hist.jpg')
# 房价top20
top10_communities = newhouse_price_data.sort_values(by=['价格'], ascending=False).head(10)
top10_communities.plot(kind='bar', x='楼盘名', y='价格', title='赣州市房价最高的10个楼盘', figsize=(20, 10))
plt.savefig('top10_communities_bar.jpg')
# 房价bottom10
bottom10_communities = newhouse_price_data.sort_values(by=['价格'], ascending=False).tail(10)
bottom10_communities.plot(kind='bar', x='楼盘名', y='价格', title='赣州市房价最低的10个楼盘', figsize=(20, 10))
plt.savefig('bottom10_communities_bar.jpg')
# 按区县分组统计楼盘数量
group_by_district_num_data = newhouse_price_data['楼盘名'].groupby(newhouse_price_data['区县']).count()
# 因为group_by_district_num_data的类型为pandas的series,所以需要先转换为dict,再转换成dataframe类型再用pandas画图
group_by_district_num = pd.DataFrame(
{'区县': group_by_district_num_data.index, '在售楼盘数量': group_by_district_num_data.values})
group_by_district_num.sort_values(by='在售楼盘数量', ascending=False).plot(kind='bar', x='区县', y='在售楼盘数量',
title='赣州各区县在售楼盘分布', figsize=(20, 10))
plt.savefig('district_group_num_bar.jpg')
# 按区县分组统计楼盘价格
group_by_district_price_data = newhouse_price_data['价格'].groupby(newhouse_price_data['区县']).median()
print(group_by_district_price_data)
# 因为group_by_district_price_data的类型为pandas的series,所以需要先转换为dict,再转换成dataframe类型再用pandas画图
group_by_district_price_median = pd.DataFrame(
{'区县': group_by_district_price_data.index, '在售楼盘价格中位值': group_by_district_price_data.values})
group_by_district_price_median.sort_values(by='在售楼盘价格中位值', ascending=False).plot(kind='bar', x='区县', y='在售楼盘价格中位值',
title='赣州各区县在售楼盘价格中位值',
figsize=(20, 10))
plt.savefig('district_group_price_median_bar.jpg')
# 输出图表
plt.show()
# 保存csv文件
top10_communities.to_csv('top10_communities.csv', index=False)
bottom10_communities.to_csv('bottom10_communities.csv', index=False)
group_by_district.to_csv('real_state_in_district.csv', index=False)
if __name__ == '__main__':
main()
作者:机械键盘让我忍不住敲代码