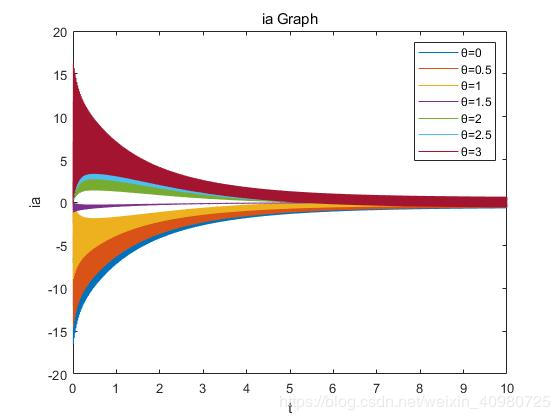
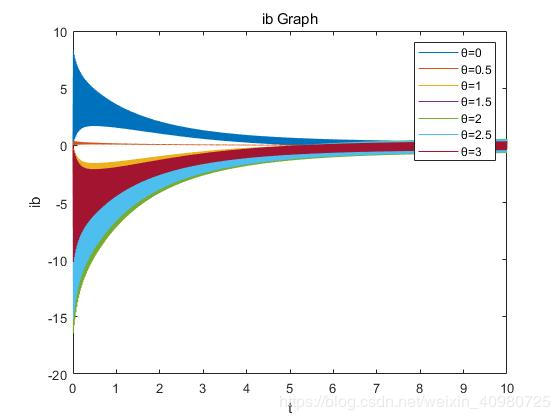
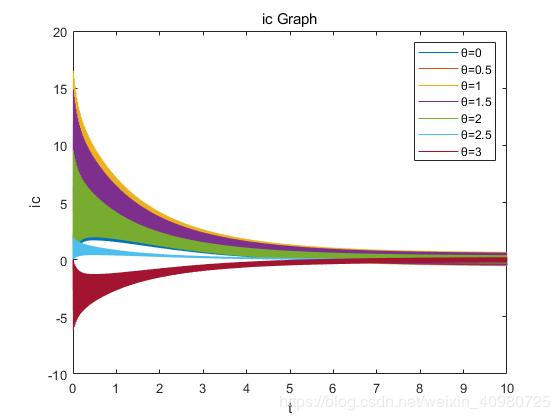
matlab 编程计算θ0的变化对三相短路电流的影响(电力系统暂态分析)
matlab 编程计算θ0的变化对三相短路电流的影响(电力系统暂态分析)
作者:一块xiaobinggan
代码:
xd=2.26;
xq=2.26;
xd1=0.269; %xd’
xq1=0.269;%xq’
xd2=0.167; %xd’’
xq2=0.167; %xq’’
Eq0=1;
t=0;
Ta=2;
Td1=0.85; %Td’
Td2=0.1; %Td’’
w0=100*pi;
theta=0;
figure(1);
for theta=0:0.5:pi
t=[0:0.01:10];
ia=power(2,1/2)*Eq0*[(1/xd2-1/xd1)*exp(-t/Td2)+(1/xd1-1/xd)*exp(-t/Td1)+1/xd].*cos(theta+w0*t)-power(2,1/2)*Eq0*cos(theta)*exp(-t/Ta)/xd2;
plot(t,ia),xlabel('t'),ylabel('ia'),title('ia Graph');
hold on
end
figure(2);
for theta=0:0.5:pi
t=[0:0.01:10];
ib=power(2,1/2)*Eq0*[(1/xd2-1/xd1)*exp(-t/Td2)+(1/xd1-1/xd)*exp(-t/Td1)+1/xd].*cos(theta+w0*t-2*pi/3)-power(2,1/2)*Eq0*cos(theta-2*pi/3)*exp(-t/Ta)/xd2;
plot(t,ib),xlabel('t'),ylabel('ib'),title('ib Graph');
hold on
end
figure(3)
for theta=0:0.5:pi
t=[0:0.01:10];
ic=power(2,1/2)*Eq0*[(1/xd2-1/xd1)*exp(-t/Td2)+(1/xd1-1/xd)*exp(-t/Td1)+1/xd].*cos(theta+w0*t+2*pi/3)-power(2,1/2)*Eq0*cos(theta+2*pi/3)*exp(-t/Ta)/xd2;
plot(t,ic),xlabel('t'),ylabel('ic'),title('ic Graph');
hold on
end


图例是生成图片后在figure里加的
作者:一块xiaobinggan
相关文章
Vanessa
2020-12-27
Chynna
2021-04-13
Kara
2020-02-29
Rohana
2021-03-05
Torie
2021-04-28
Tia
2023-05-12
Damara
2023-05-12
Jennifer
2023-05-12
Rosalia
2023-05-12
Rhea
2023-05-12
Katherine
2023-05-12
Diane
2023-05-13
Chipo
2023-05-13
Fawn
2023-05-17
Oria
2023-07-17
Malina
2023-07-20
Iria
2023-07-20