[Pyhon疫情大数据分析] 四.微博话题抓取及新冠肺炎疫情文本挖掘和情感分析
思来想去,虽然很忙,但还是挤时间针对这次肺炎疫情写个Python大数据分析系列博客,包括网络爬虫、可视化分析、GIS地图显示、情感分析、舆情分析、主题挖掘、威胁情报溯源、知识图谱、预测预警及AI和NLP应用等。希望该系列线上远程教学对您有所帮助,也希望早点战胜病毒,武汉加油、湖北加油、全国加油。待到疫情结束樱花盛开,这座英雄的城市等你们来。
首先说声抱歉,最近一直忙着学习安全知识,其他系列文章更新较慢,已经有一些人催更了。言归正传,前文分享了疫情相关新闻数据爬取,并进行中文分词处理及文本聚类、LDA主题模型分析。这篇文章将抓取微博话题及评论信息,采用SnowNLP进行简单的情感分析及文本挖掘,包括随时间的情感分布。希望这篇基础性文章对您有所帮助,也非常感谢参考文献中老师的分享,一起加油,战胜疫情!如果您有想学习的知识或建议,可以给作者留言~
 ', '', find_title) #正则匹配掉html标签
print ("title_text = ", title_text)
#楼主ID
title_user_id = re.findall('.*?"id": (.*?),.*?', html_text)[1]
print ("title_user_id = ", title_user_id)
#楼主昵称
title_user_NicName = re.findall('.*?"screen_name": "(.*?)",.*?', html_text)[0]
print ("title_user_NicName = ", title_user_NicName)
#楼主性别
title_user_gender = re.findall('.*?"gender": "(.*?)",.*?', html_text)[0]
print ("title_user_gender = ", title_user_gender)
#发布时间
created_title_time = re.findall('.*?"created_at": "(.*?)".*?', html_text)[0].split(' ')
#日期
if 'Mar' in created_title_time:
title_created_YMD = "{}/{}/{}".format(created_title_time[-1], '03', created_title_time[2])
elif 'Feb' in created_title_time:
title_created_YMD = "{}/{}/{}".format(created_title_time[-1], '02', created_title_time[2])
elif 'Jan' in created_title_time:
title_created_YMD = "{}/{}/{}".format(created_title_time[-1], '01', created_title_time[2])
else:
print ('该时间不在疫情范围内,估计数据有误!URL = ')
pass
print ("title_created_YMD = ", title_created_YMD)
#发布时间
add_title_time = created_title_time[3]
print ("add_title_time = ", add_title_time)
#转发量
reposts_count = re.findall('.*?"reposts_count": (.*?),.*?', html_text)[0]
print ("reposts_count = ", reposts_count)
#评论量
comments_count = re.findall('.*?"comments_count": (.*?),.*?', html_text)[0]
print ("comments_count = ", comments_count)
#点赞量
attitudes_count = re.findall('.*?"attitudes_count": (.*?),.*?', html_text)[0]
print ("attitudes_count = ", attitudes_count)
comment_count = int(int(comments_count) / 20) #每个ajax一次加载20条数据
position1 = (article_url, title_text, title_user_id, title_user_NicName,title_user_gender, title_created_YMD, add_title_time, reposts_count, comments_count, attitudes_count, " ", " ", " ", " "," ", " ")
#写入数据
writer.writerow((position1))
return comment_count
except:
pass
#-------------------------------------------------抓取评论信息---------------------------------------------------
#comment_ID话题编号
def get_page(comment_ID, max_id, id_type):
params = {
'max_id': max_id,
'max_id_type': id_type
}
url = ' https://m.weibo.cn/comments/hotflow?id={}&mid={}&max_id'.format(comment_ID, comment_ID)
try:
r = requests.get(url, params=params, headers=headers)
if r.status_code == 200:
return r.json()
except requests.ConnectionError as e:
print('error', e.args)
pass
#-------------------------------------------------抓取评论item最大值---------------------------------------------------
def parse_page(jsondata):
if jsondata:
items = jsondata.get('data')
item_max_id = {}
item_max_id['max_id'] = items['max_id']
item_max_id['max_id_type'] = items['max_id_type']
return item_max_id
#-------------------------------------------------抓取评论信息---------------------------------------------------
def write_csv(jsondata):
for json in jsondata['data']['data']:
#用户ID
user_id = json['user']['id']
# 用户昵称
user_name = json['user']['screen_name']
# 用户性别,m表示男性,表示女性
user_gender = json['user']['gender']
#获取评论
comments_text = json['text']
comment_text = re.sub(']*>.*?|', '', comments_text) #正则匹配掉html标签
# 评论时间
created_times = json['created_at'].split(' ')
if 'Feb' in created_times:
created_YMD = "{}/{}/{}".format(created_times[-1], '02', created_times[2])
elif 'Jan' in created_times:
created_YMD = "{}/{}/{}".format(created_times[-1], '01', created_times[2])
else:
print ('该时间不在疫情范围内,估计数据有误!')
pass
created_time = created_times[3] #评论时间时分秒
#if len(comment_text) != 0:
position2 = (" ", " ", " ", " "," ", " ", " ", " ", " ", " ", user_id, user_name, user_gender, created_YMD, created_time, comment_text)
writer.writerow((position2))#写入数据
#print (user_id, user_name, user_gender, created_YMD, created_time)
#-------------------------------------------------主函数---------------------------------------------------
def main():
count_title = len(comments_ID)
for count, comment_ID in enumerate(comments_ID):
print ("正在爬取第%s个话题,一共找到个%s话题需要爬取"%(count+1, count_title))
#maxPage获取返回的最大评论数量
maxPage = spider_title(comment_ID)
print ('maxPage = ', maxPage)
m_id = 0
id_type = 0
if maxPage != 0: #小于20条评论的不需要循环
try:
#用评论数量控制循环
for page in range(0, maxPage):
#自定义函数-抓取网页评论信息
jsondata = get_page(comment_ID, m_id, id_type)
#自定义函数-写入CSV文件
write_csv(jsondata)
#自定义函数-获取评论item最大值
results = parse_page(jsondata)
time.sleep(1)
m_id = results['max_id']
id_type = results['max_id_type']
except:
pass
print ("--------------------------分隔符---------------------------")
csvfile.close()
if __name__ == '__main__':
#获取话题ID
get_title_id()
#主函数操作
main()
#计算使用时间
endTime = time.time()
useTime = (endTime-startTime) / 60
print("该次所获的信息一共使用%s分钟"%useTime)
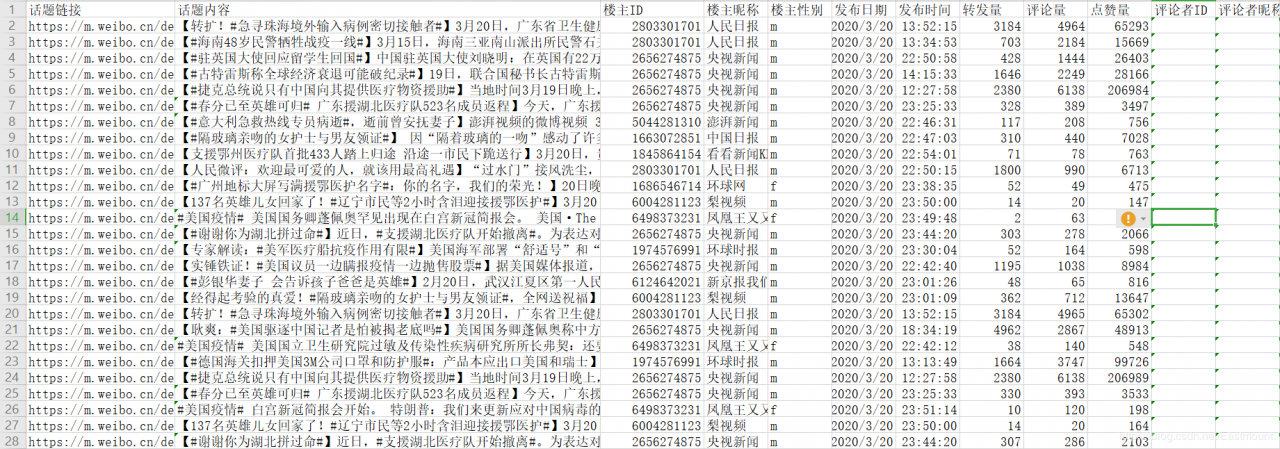
保存数据截图如下图所示:
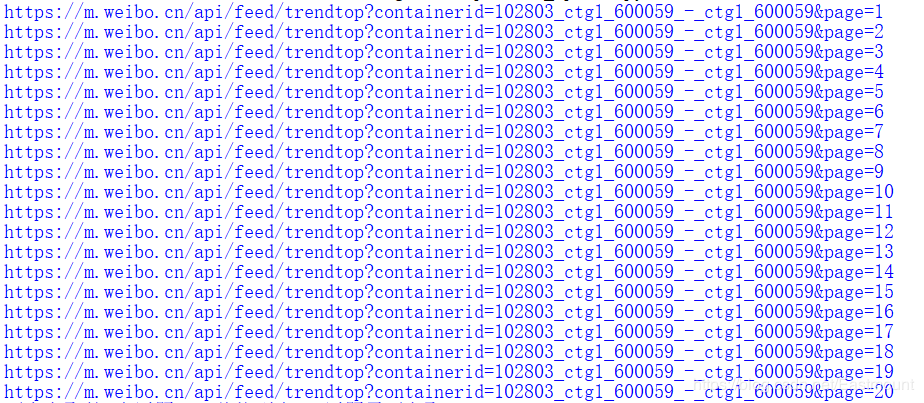
下图时抓取的话题页面网址,每个页面包括18个话题。
接着抓取每个话题的内容,如下所示:
正在爬取第1个话题,一共找到个361话题需要爬取
article_url =  https://m.weibo.cn/detail/4484575189181757
title_text =  【#国家卫健委回应健康码互通互认#】国家卫生健康委规划司司长毛群安:目前全国低风险县域已占98%,各省份正在按照统一的数据格式标准和内容要求,加快向全国一体化平台汇聚本地区防疫健康信息的目录。截至目前,#全国绝大多数健康码可实现一码通行#。 人民日报的微博视频
title_user_id =  2803301701
title_user_NicName =  人民日报
title_user_gender =  m
该时间不在疫情范围内,估计数据有误!URL =
maxPage =  None
--------------------------分隔符---------------------------
正在爬取第2个话题,一共找到个361话题需要爬取
article_url =  https://m.weibo.cn/detail/4484288164243251
title_text =  法国网友自称自己成了长发公主,度过了居家隔离后的第三天.....#全球疫情##法国疫情# 法国囧事的微博视频
title_user_id =  2981906842
title_user_NicName =  法国囧事
title_user_gender =  m
该时间不在疫情范围内,估计数据有误!URL =
maxPage =  None
--------------------------分隔符---------------------------
正在爬取第3个话题,一共找到个361话题需要爬取
article_url =  https://m.weibo.cn/detail/4484492666507389
title_text =  #全球疫情# #意大利疫情# #意大利# “罗马还有其他四处的药店都遭到了抢劫。我们遭受到的是持械抢劫。“这是一位罗马药店药剂师的陈述。她说,在当前疫情的危机情况下,我们处在两难困境之中:受到抢劫和疾病的双重威胁。疫情之下,意大利口罩告急,价格飙高。市民认为是药店不卖,而真实情况是药店真的没有,而供货商又抬高了价格。药店处在两难境地。这位药剂师道出了自己的苦衷,冒着危险还在工作,与医护人员一样,都是奋斗在一线做出牺牲的人。呼吁民众理解,也请求大家的帮助。 Nita大呵呵的微博视频
title_user_id =  6476189426
title_user_NicName =  Nita大呵呵
title_user_gender =  f
该时间不在疫情范围内,估计数据有误!URL =
maxPage =  None
最终抓取360个疫情话题内容。
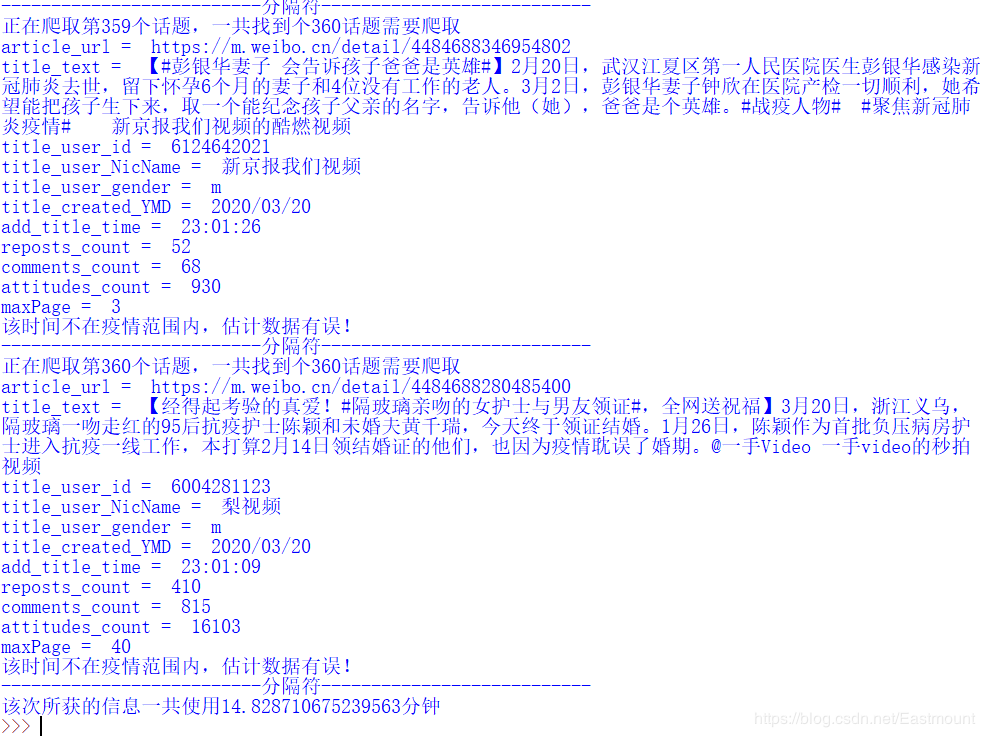
注意:该爬虫评论写入功能需要改进下,且只能抓取当天的“战疫情”话题及评论,如果想针对某个突发事件进行一段时间的分析,建议每天定时运行该程序,从而形成所需的数据集。也可以根据需求修改为热点话题的抓取,增加搜索功能等。
作者前文:
[python爬虫] Selenium爬取新浪微博内容及用户信息
[Python爬虫] Selenium爬取新浪微博客户端用户信息、热点话题及评论 (上)
[Python爬虫] Selenium爬取新浪微博移动端热点话题及评论 (下)
二.微博话题词云分析
首先,我们对文本进行简单的词云可视化分析。
1.基本用法词云分析主要包括两种方法:
调用WordCloud扩展包画图(兼容性极强,之前介绍过) 调用PyEcharts中的WordCloud子包画图(本文推荐新方法)PyEcharts绘制词云的基础代码如下:
# coding=utf-8
from pyecharts import options as opts
from pyecharts.charts import WordCloud
from pyecharts.globals import SymbolType
# 数据
words = [
    ('背包问题', 10000),
    ('大整数', 6181),
    ('Karatsuba乘法算法', 4386),
    ('穷举搜索', 4055),
    ('傅里叶变换', 2467),
    ('状态树遍历', 2244),
    ('剪枝', 1868),
    ('Gale-shapley', 1484),
    ('最大匹配与匈牙利算法', 1112),
    ('线索模型', 865),
    ('关键路径算法', 847),
    ('最小二乘法曲线拟合', 582),
    ('二分逼近法', 555),
    ('牛顿迭代法', 550),
    ('Bresenham算法', 462),
    ('粒子群优化', 366),
    ('Dijkstra', 360),
    ('A*算法', 282),
    ('负极大极搜索算法', 273),
    ('估值函数', 265)
]
# 渲染图
def wordcloud_base() -> WordCloud:
    c = (
        WordCloud()
        .add("", words, word_size_range=[20, 100], shape='diamond')  # SymbolType.ROUND_RECT
        .set_global_opts(title_opts=opts.TitleOpts(title='WordCloud词云'))
    )
    return c
# 生成图
wordcloud_base().render('词云图.html')
输出结果如下图所示,出现词频越高显示越大。

核心代码为:
add(name, attr, value, shape=“circle”, word_gap=20, word_size_range=None, rotate_step=45)
2.疫情词云
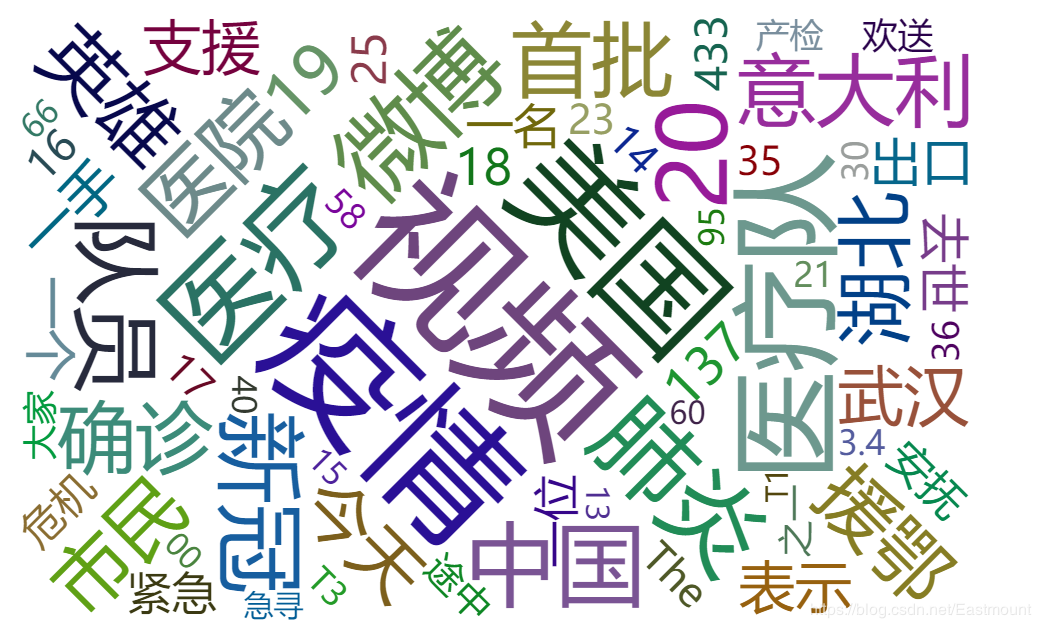
接着我们将3月20日疫情内容复制至“data.txt”文本,经过中文分词后显示前1000个高频词的词云。代码如下:
# coding=utf-8
import jieba
import re
import time
from collections import Counter
#------------------------------------中文分词------------------------------------
cut_words = ""
all_words = ""
f = open('C-class-fenci.txt', 'w')
for line in open('C-class.txt', encoding='utf-8'):
    line.strip('\n')
    seg_list = jieba.cut(line,cut_all=False)
    # print(" ".join(seg_list))
    cut_words = (" ".join(seg_list))
    f.write(cut_words)
    all_words += cut_words
else:
    f.close()
# 输出结果
all_words = all_words.split()
print(all_words)
# 词频统计
c = Counter()
for x in all_words:
    if len(x)>1 and x != '\r\n':
        c[x] += 1
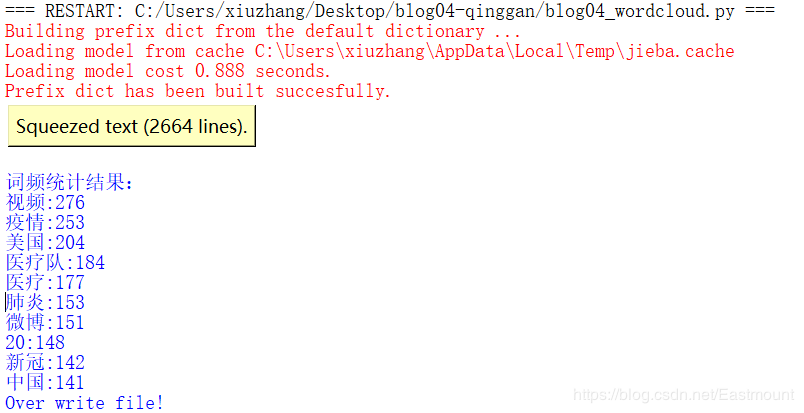
# 输出词频最高的前10个词
print('\n词频统计结果:')
for (k,v) in c.most_common(10):
    print("%s:%d"%(k,v))
# 存储数据
name = time.strftime("%Y-%m-%d") + "-fc.csv"
fw = open(name, 'w', encoding='utf-8')
i = 1
for (k,v) in c.most_common(len(c)):
    fw.write(str(i)+','+str(k)+','+str(v)+'\n')
    i = i + 1
else:
    print("Over write file!")
    fw.close()
#------------------------------------词云分析------------------------------------
from pyecharts import options as opts
from pyecharts.charts import WordCloud
from pyecharts.globals import SymbolType
# 生成数据 word = [('A',10), ('B',9), ('C',8)] 列表+Tuple
words = []
for (k,v) in c.most_common(1000):
    # print(k, v)
    words.append((k,v))
# 渲染图
def wordcloud_base() -> WordCloud:
    c = (
        WordCloud()
        .add("", words, word_size_range=[20, 100], shape=SymbolType.ROUND_RECT)
        .set_global_opts(title_opts=opts.TitleOpts(title='全国新型冠状病毒疫情词云图'))
    )
    return c
# 生成图
wordcloud_base().render('疫情词云图.html')
输出结果如下图所示,仅3月20日的热点话题内容。
3.WordCloud
另一种方法的代码如下:
# coding=utf-8
import jieba
import re
import sys
import time
from collections import Counter
import matplotlib.pyplot as plt
from wordcloud import WordCloud
#------------------------------------中文分词------------------------------------
cut_words = ""
all_words = ""
f = open('data-fenci.txt', 'w')
for line in open('data.txt', encoding='utf-8'):
    line.strip('\n')
    seg_list = jieba.cut(line,cut_all=False)
    # print(" ".join(seg_list))
    cut_words = (" ".join(seg_list))
    f.write(cut_words)
    all_words += cut_words
else:
    f.close()
# 输出结果
all_words = all_words.split()
print(all_words)
# 词频统计
c = Counter()
for x in all_words:
    if len(x)>1 and x != '\r\n':
        c[x] += 1
# 输出词频最高的前10个词
print('\n词频统计结果:')
for (k,v) in c.most_common(10):
    print("%s:%d"%(k,v))
# 存储数据
name = time.strftime("%Y-%m-%d") + "-fc.csv"
fw = open(name, 'w', encoding='utf-8')
i = 1
for (k,v) in c.most_common(len(c)):
    fw.write(str(i)+','+str(k)+','+str(v)+'\n')
    i = i + 1
else:
    print("Over write file!")
    fw.close()
#------------------------------------词云分析------------------------------------
#打开本体TXT文件
text = open('data.txt').read()
#结巴分词 cut_all=True 设置为精准模式
wordlist = jieba.cut(text, cut_all = False)
#使用空格连接 进行中文分词
wl_space_split = " ".join(wordlist)
#print(wl_space_split)
#对分词后的文本生成词云
my_wordcloud = WordCloud().generate(wl_space_split)
#显示词云图
plt.imshow(my_wordcloud)
#是否显示x轴、y轴下标
plt.axis("off")
plt.show()
三.SnowNLP情感分析用法
情感分析的基本流程如下图所示,通常包括:
自定义爬虫抓取文本信息; 使用Jieba工具进行中文分词、词性标注; 定义情感词典提取每行文本的情感词; 通过情感词构建情感矩阵,并计算情感分数; 结果评估,包括将情感分数置于0.5到-0.5之间,并可视化显示。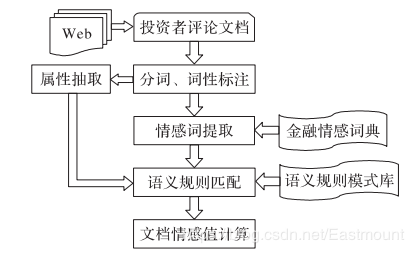
SnowNLP是一个常用的Python文本分析库,是受到TextBlob启发而发明的。由于当前自然语言处理库基本都是针对英文的,而中文没有空格分割特征词,Python做中文文本挖掘较难,后续开发了一些针对中文处理的库,例如SnowNLP、Jieba、BosonNLP等。注意SnowNLP处理的是unicode编码,所以使用时请自行decode成unicode。
Snownlp主要功能包括:
中文分词(算法是Character-Based Generative Model) 词性标注(原理是TnT、3-gram 隐马) 情感分析 文本分类(原理是朴素贝叶斯) 转换拼音、繁体转简体 提取文本关键词(原理是TextRank) 提取摘要(原理是TextRank)、分割句子 文本相似(原理是BM25)推荐官网给大家学习。
安装和其他库一样,使用pip安装即可。
pip install snownlp

2.中文分词
下面是最简单的实例,使用SnowNLP进行中文分词,同时比较了SnowNLP和Jieba库的分词效果。
# -*- coding: utf-8 -*-
from snownlp import SnowNLP
s1 = SnowNLP(u"这本书质量真不太好!")
print("SnowNLP:")
print(" ".join(s1.words))
import jieba
s2 = jieba.cut(u"这本书质量真不太好!", cut_all=False)
print("jieba:")
print(" ".join(s2))
输出结果如下所示:
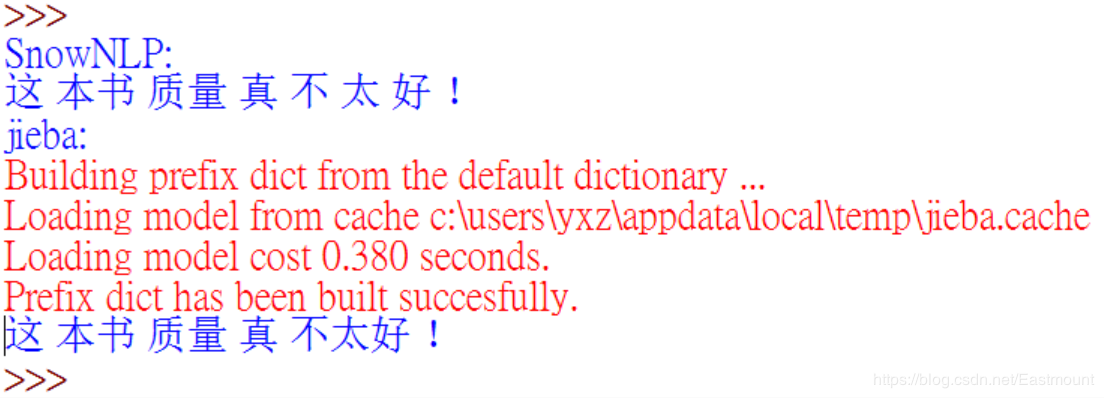
总体感觉是SnowNLP分词速度比较慢,准确度较低,比如“不太好”这个词组,但也不影响我们后续的情感分析。
3.常见功能代码如下:
# -*- coding: utf-8 -*-
from snownlp import SnowNLP
s = SnowNLP(u"这本书质量真不太好!")
print(u"\n中文分词:")
print( " ".join(s.words))
print(u"\n词性标注:")
print(s.tags)
for k in s.tags:
    print(k)
print(u"\n情感分数:")
print(s.sentiments)
print(u"\n转换拼音:")
print(s.pinyin)
print(u"\n输出前4个关键词:")
print(s.keywords(4))
for k in s.keywords(4):
    print(k)
print(u"\n输出关键句子:")
print(s.summary(1))
for k in s.summary(1):
    print(k)
print(u"\n输出tf和idf:")
print(s.tf)
print(s.idf)
n = SnowNLP(u'「繁體字」「繁體中文」的叫法在臺灣亦很常見。')
print(u"\n繁简体转换:")
print(n.han)
s.words 输出分词后的结果,词性标注主要通过 s.tags,s.sentiments 计算情感分数,s.pinyin 转换为拼音,s.keywords(4) 提取4个关键词,s.summary(1) 输出一个关键句子,s.tf 计算TF值(频率),s.idf 计算IDF值(倒文档)。
输出结果如下所示:
>>>
中文分词:
这 本书 质量 真 不 太 好 !
词性标注:
[(u'\u8fd9', u'r'), (u'\u672c\u4e66', u'r'), (u'\u8d28\u91cf', u'n'),
(u'\u771f', u'd'), (u'\u4e0d', u'd'), (u'\u592a', u'd'),
(u'\u597d', u'a'), (u'\uff01', u'w')]
(u'\u8fd9', u'r')
(u'\u672c\u4e66', u'r')
(u'\u8d28\u91cf', u'n')
(u'\u771f', u'd')
(u'\u4e0d', u'd')
(u'\u592a', u'd')
(u'\u597d', u'a')
(u'\uff01', u'w')
情感分数:
0.420002029202
转换拼音:
[u'zhe', u'ben', u'shu', u'zhi', u'liang', u'zhen', u'bu', u'tai', u'hao', u'\uff01']
输出前4个关键词:
[u'\u592a', u'\u4e0d', u'\u8d28\u91cf', u'\u771f']
太
不
质量
真
输出关键句子:
[u'\u8fd9\u672c\u4e66\u8d28\u91cf\u771f\u4e0d\u592a\u597d']
这本书质量真不太好
输出tf和idf:
[{u'\u8fd9': 1}, {u'\u672c': 1}, {u'\u4e66': 1},
{u'\u8d28': 1}, {u'\u91cf': 1}, {u'\u771f': 1},
{u'\u4e0d': 1}, {u'\u592a': 1}, {u'\u597d': 1}, {u'\uff01': 1}]
{u'\uff01': 1.845826690498331, u'\u4e66': 1.845826690498331, u'\u8d28': 1.845826690498331,
u'\u592a': 1.845826690498331, u'\u4e0d': 1.845826690498331, u'\u672c': 1.845826690498331,
u'\u91cf': 1.845826690498331, u'\u8fd9': 1.845826690498331, u'\u597d': 1.845826690498331, u'\u771f': 1.845826690498331}
繁简体转换:
「繁体字」「繁体中文」的叫法在台湾亦很常见。
>>>
同样可以进行文本相似度计算,代码参考下图所示:
 4.情感分析
SnowNLP情感分析也是基于情感词典实现的,其简单的将文本分为两类,积极和消极,返回值为情绪的概率,越接近1为积极,接近0为消极。其原理参考zhiyong_will大神和邓旭东老师的文章,也强烈推荐大家学习。地址:
情感分析——深入snownlp原理和实践
自然语言处理库之snowNLP
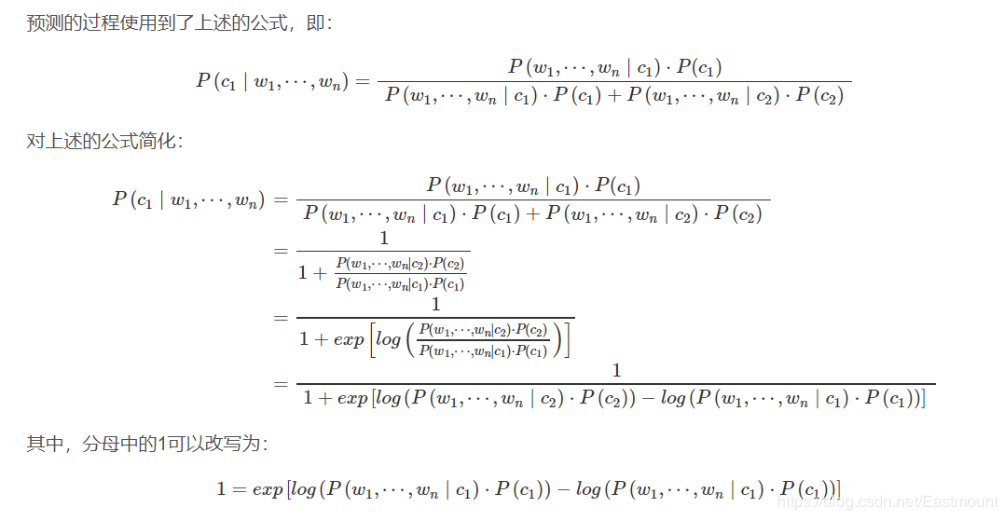
下面简单给出一个情感分析的例子:
# -*- coding: utf-8 -*-
from snownlp import SnowNLP
s1 = SnowNLP(u"我今天很开心")
print(u"s1情感分数:")
print(s1.sentiments)
s2 = SnowNLP(u"我今天很沮丧")
print(u"s2情感分数:")
print(s2.sentiments)
s3 = SnowNLP(u"大傻瓜,你脾气真差,动不动就打人")
print(u"s3情感分数:")
print(s3.sentiments)
输出结果如下所示,当负面情感特征词越多,比如“傻瓜”、“差”、“打人”等,分数就会很低,同样当正免情感词多分数就高。
s1情感分数:
0.84204018979
s2情感分数:
0.648537121839
s3情感分数:
0.0533215596706
而在真实项目中,通常需要根据实际的数据重新训练情感分析的模型,导入正面样本和负面样本,再训练新模型。
sentiment.train(’./neg.txt’, ‘./pos.txt’) sentiment.save(‘sentiment.marshal’)四.SnowNLP微博情感分析实例
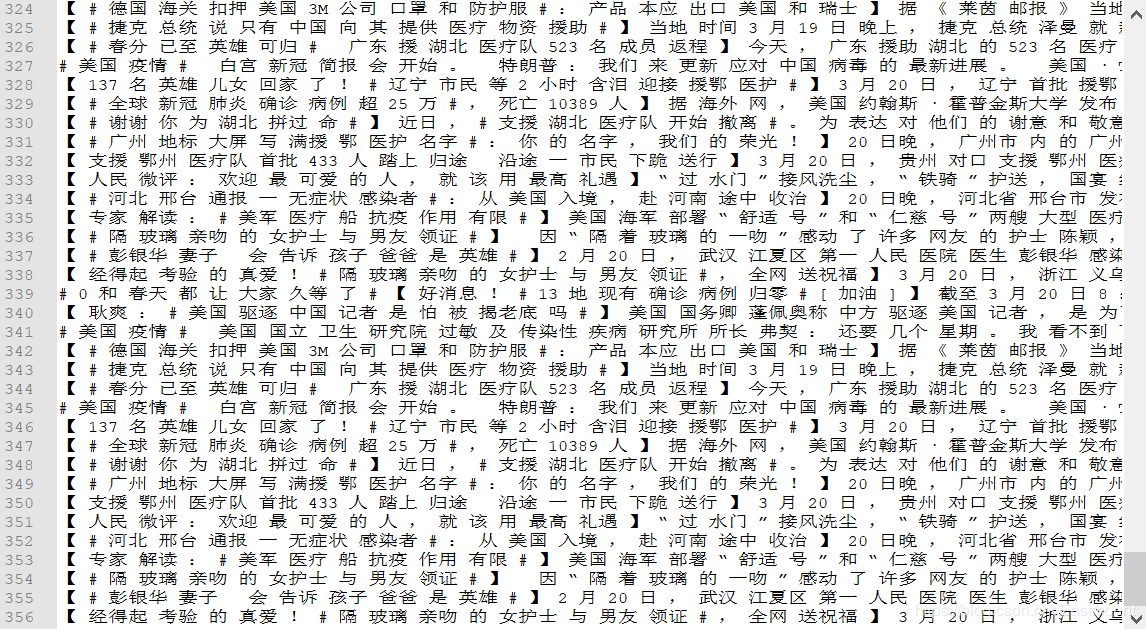
下面的代码是对爬取的疫情话题进行情感分析。本文将抓取的356条(其中4条仅图片)微博疫情话题信息复制至TXT文件中 ,每一行为一条话题,再对其进行中文分词处理。注意,这里仅仅获取序号1-356的情感分数,而其他情感分析可以进行时间对比、主题对比等,其方法和此篇文章类似,希望读者学会举一反三。
1.情感各分数段出现频率
首先统计各情感分数段出现的评率并绘制对应的柱状图,代码如下:
# -*- coding: utf-8 -*-
from snownlp import SnowNLP
import codecs
import os
source = open("data.txt","r", encoding='utf-8')
line = source.readlines()
sentimentslist = []
for i in line:
    s = SnowNLP(i)
    print(s.sentiments)
    sentimentslist.append(s.sentiments)
import matplotlib.pyplot as plt
import numpy as np
plt.hist(sentimentslist, bins = np.arange(0, 1, 0.01), facecolor = 'g')
plt.xlabel('Sentiments Probability')
plt.ylabel('Quantity')
plt.title('Analysis of Sentiments')
plt.show()
输出结果如下图所示,可以看到
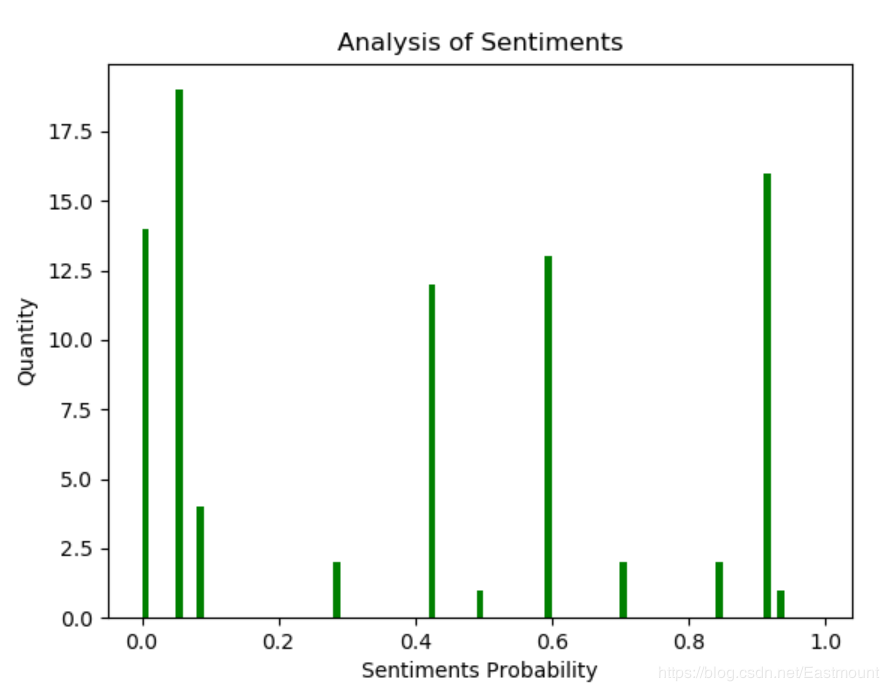
对应的分数如下:
>>>
4.440892098500626e-16
0.49055395607520824
0.9999999999972635
0.9999998677093149
0.9979627586368516
0.9999999990959509
0.9999830199233769
0.9998699310812647
0.9999954477924106
...
2.情感波动分析
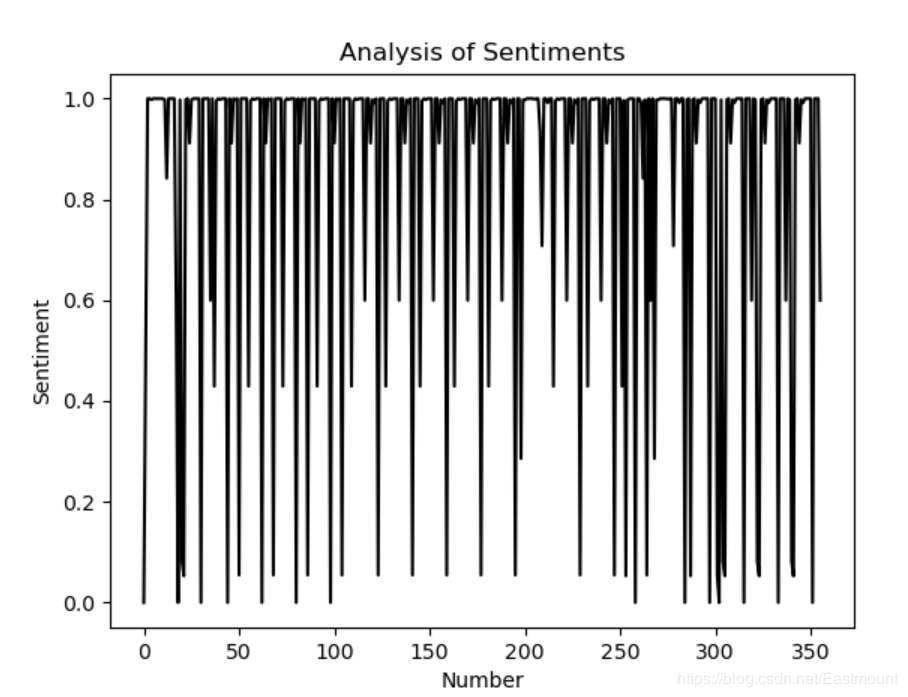
接下来分析每条评论的波动情况,代码如下所示:
# -*- coding: utf-8 -*-
from snownlp import SnowNLP
import codecs
import os
source = open("data.txt","r", encoding='utf-8')
line = source.readlines()
sentimentslist = []
for i in line:
    s = SnowNLP(i)
    print(s.sentiments)
    sentimentslist.append(s.sentiments)
import matplotlib.pyplot as plt
import numpy as np
plt.plot(np.arange(0, 356, 1), sentimentslist, 'k-')
plt.xlabel('Number')
plt.ylabel('Sentiment')
plt.title('Analysis of Sentiments')
plt.show()
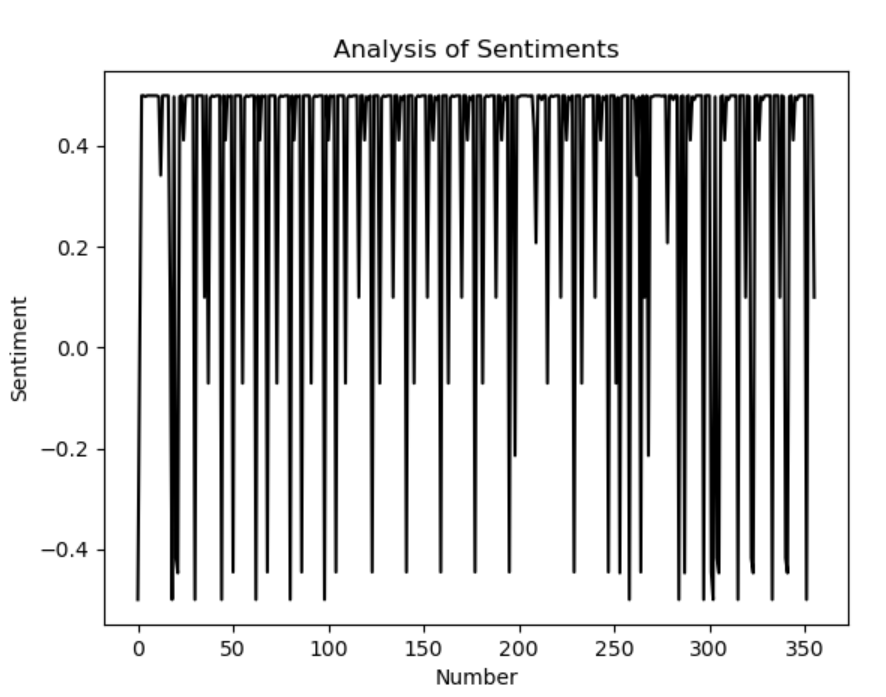
输出结果如下所示,呈现一条曲线,因为抓取的评论基本都是好评,所以分数基本接近于1.0,而真实分析过程中存在好评、中评和差评,曲线更加规律。
同时,在做情感分析的时候,我看到很多论文都是将情感区间从[0, 1.0]转换为[-0.5, 0.5],这样的曲线更加好看,位于0以上的是积极评论,反之消极评论。修改代码如下:
# -*- coding: utf-8 -*-
from snownlp import SnowNLP
import codecs
import os
#获取情感分数
source = open("data.txt","r", encoding='utf-8')
line = source.readlines()
sentimentslist = []
for i in line:
    s = SnowNLP(i)
    print(s.sentiments)
    sentimentslist.append(s.sentiments)
#区间转换为[-0.5, 0.5]
result = []
i = 0
while i<len(sentimentslist):
    result.append(sentimentslist[i]-0.5)
    i = i + 1
#可视化画图
import matplotlib.pyplot as plt
import numpy as np
plt.plot(np.arange(0, 356, 1), result, 'k-')
plt.xlabel('Number')
plt.ylabel('Sentiment')
plt.title('Analysis of Sentiments')
plt.show()
绘制图形如下所示:

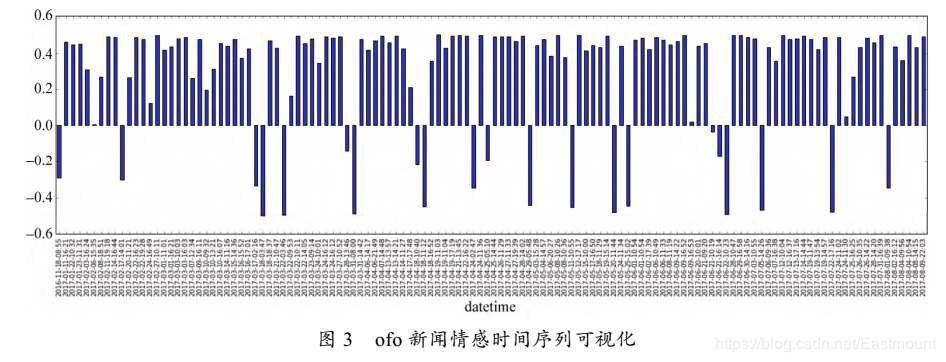
3.情感时间分布
最后补充随时间分布的情感分数相关建议,读者可能也发现抓取的博客存在重复、时间不均衡等现象。微博数据还是非常不好抓取,数据卡住了很多人,也请读者深入分析下。
(1) 情感分析通常需要和评论时间结合起来,并进行舆情预测等,建议读者尝试将时间结合。比如王树义老师的文章《基于情感分类的竞争企业新闻文本主题挖掘》。
(2) 情感分析也是可以进行评价的,我们前面抓取的分为5星评分,假设0-0.2位一星,0.2-0.4位二星,0.4-0.6为三星,0.6-0.8为四星,0.8-1.0为五星,这样我们可以计算它的准确率,召回率,F值,从而评论我的算法好坏。
(3) 作者还有很多情感分析结合幂率分布的知识,因为需要写文章,这里暂时不进行分享,但是这篇基础文章对初学者仍然有一定的帮助。
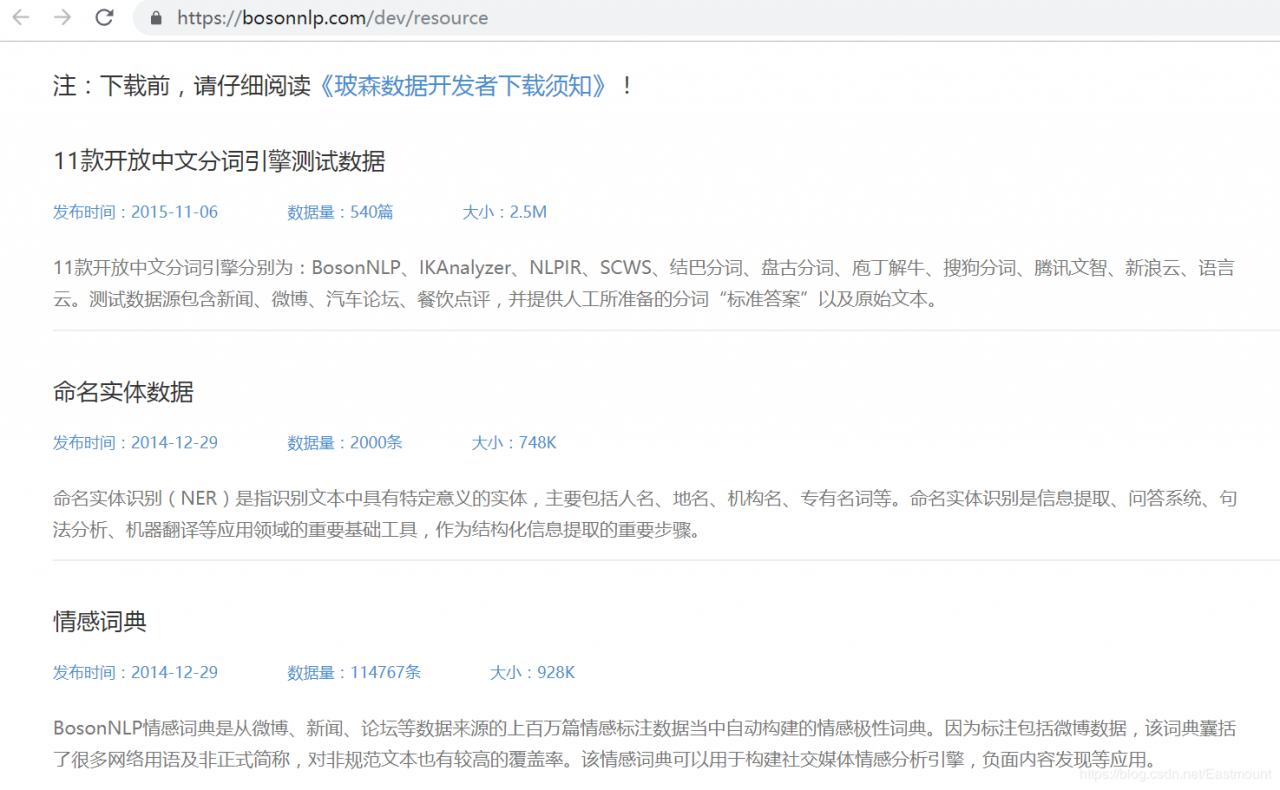
(4) BosonNLP也是一个比较不错的情感分析包,建议感兴趣的读者学习,它提供了相关的词典,如下:https://bosonnlp.com/dev/resource。
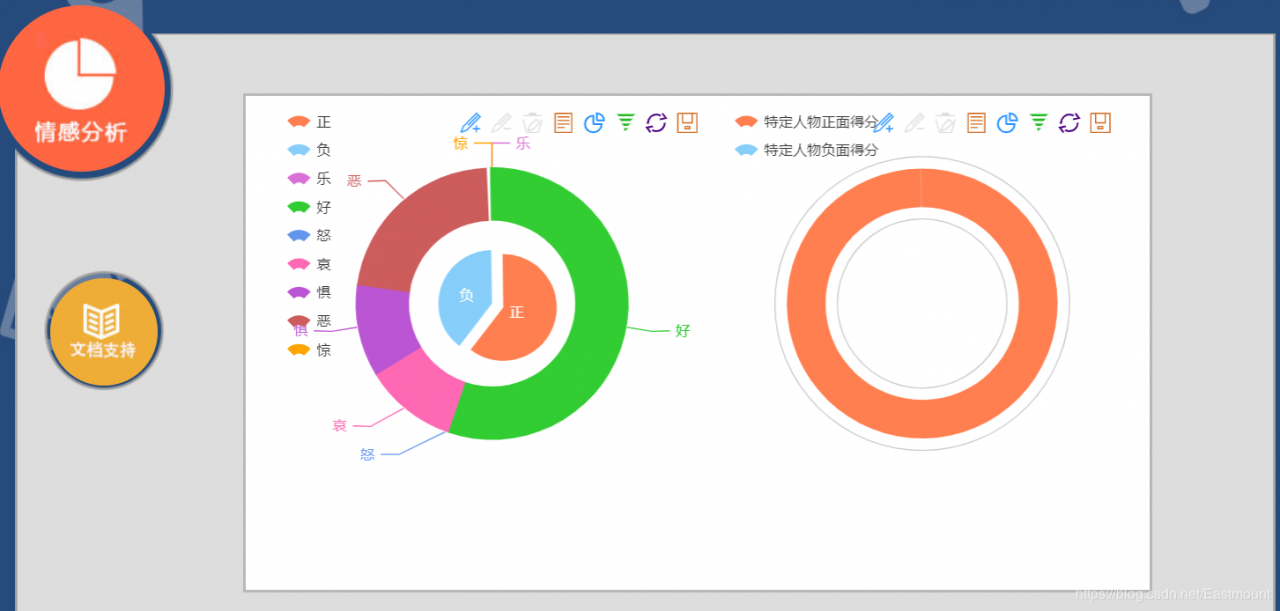
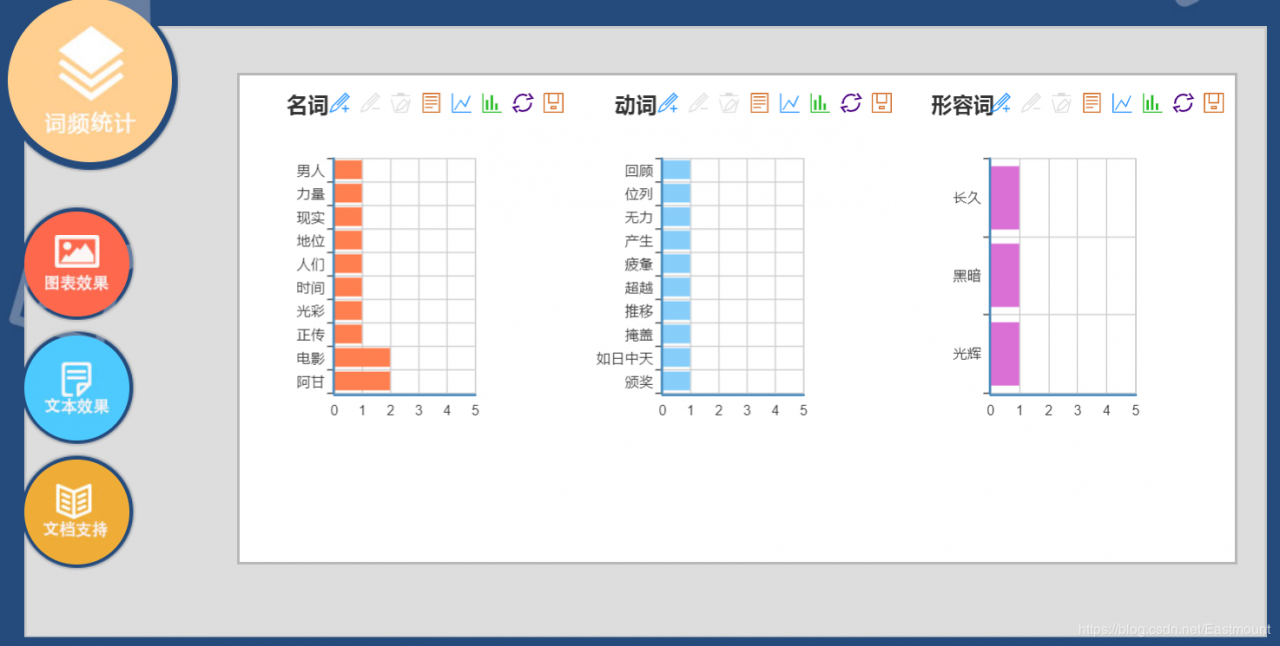
(5) 读者如果不太擅长写代码,可以尝试使用情感分析系统。http://ictclas.nlpir.org/nlpir/
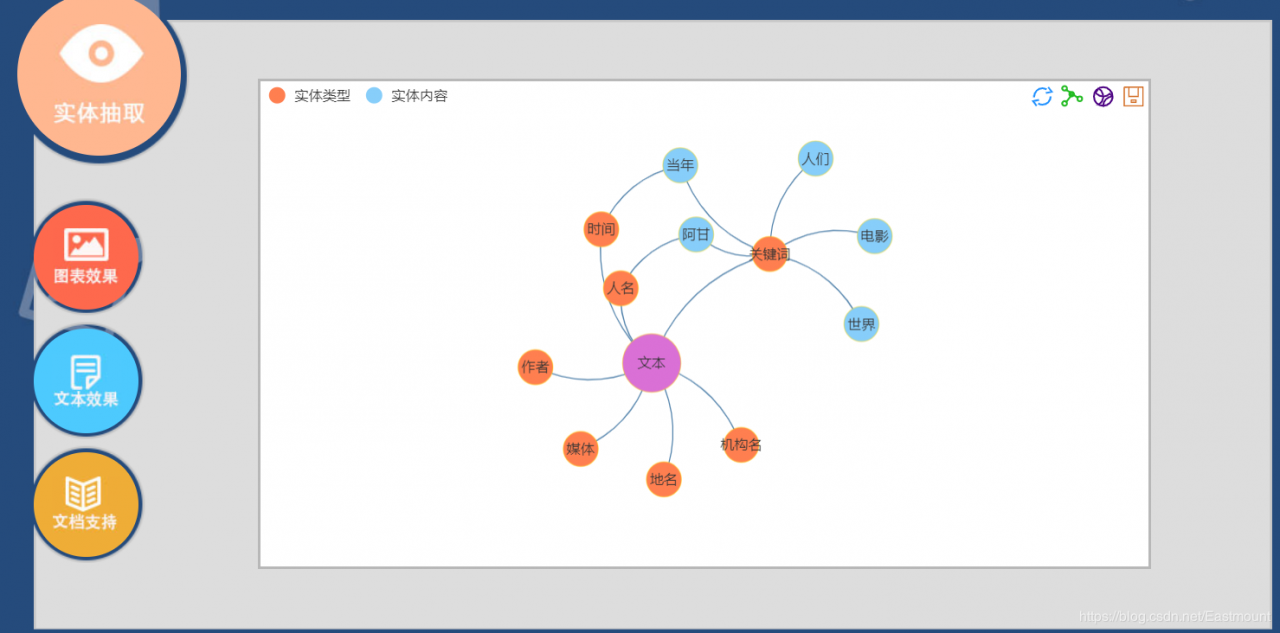 五.总结
五.总结
写到这里,第四篇疫情分析的文章就讲解完毕,希望对您有所帮助,尤其是想写文本挖掘论文的读者。后续还会分享舆情分析、威胁情报溯源、知识图谱、预测预警及AI和NLP应用等。如果文章对您有所帮助,将是我写作的最大动力。作者将源代码上传至github,大家可以直接下载。你们的支持就是我撰写的最大动力,加油~
同时,向钟院士致敬,向一线工作者致敬。侠之大者,为国为民。咱们中国人一生的最高追求,为天地立心,为生民立命,为往圣继绝学,为万世开太平。以一人之力系万民康乐,以一身犯险保大业安全。他们真是做到了,武汉加油,中国加油!

(By:Eastmount 2020-03-21 中午12点于贵阳 http://blog.csdn.net/eastmount/)
参考文献:
[1] [python数据挖掘课程] 十三.WordCloud词云配置过程及词频分析 - Eastmount
[2] python爬虫爬取微博之战疫情用户评论及详情
[3] [python爬虫] Selenium爬取新浪微博内容及用户信息
[4] [Python爬虫] Selenium爬取新浪微博客户端用户信息、热点话题及评论 (上)
[5] [Python爬虫] Selenium爬取新浪微博移动端热点话题及评论 (下)
[6] 用pyecharts绘制词云WordCloud - pennyyangpei
[7] 情感分析——深入snownlp原理和实践
[8] 自然语言处理库之snowNLP
[9] 王树义老师的文章《基于情感分类的竞争企业新闻文本主题挖掘》
作者:Eastmount