据Python爬虫不靠谱预测可知今年双十一销售额将超过6000亿元
不知不觉,双十一到今年已经是13个年头,每年大家都在满心期待看着屏幕上的数字跳动,年年打破记录。而 2019 年的天猫双11的销售额却被一位微博网友提前7个月用数据拟合的方法预测出来了。他的预测值是2675.37或者2689.00亿元,而实际成交额是2684亿元。只差了5亿元,误差率只有千分之一。
但如果你用同样的方法去做预测2020年的时候,发现预测是3282亿,实际却到了 4982亿。原来2020改了规则,实际上统计的是11月1到11日的销量,理论上已经不能和历史数据合并预测,但咱们就为了图个乐,主要是为了练习一下 Python 的多项式回归和可视化绘图。
把预测先发出来:今年双十一的销量是 9029.688 亿元!坐等双十一,各位看官回来打我的脸。欢迎文末技术交流学习,喜欢点赞支持。
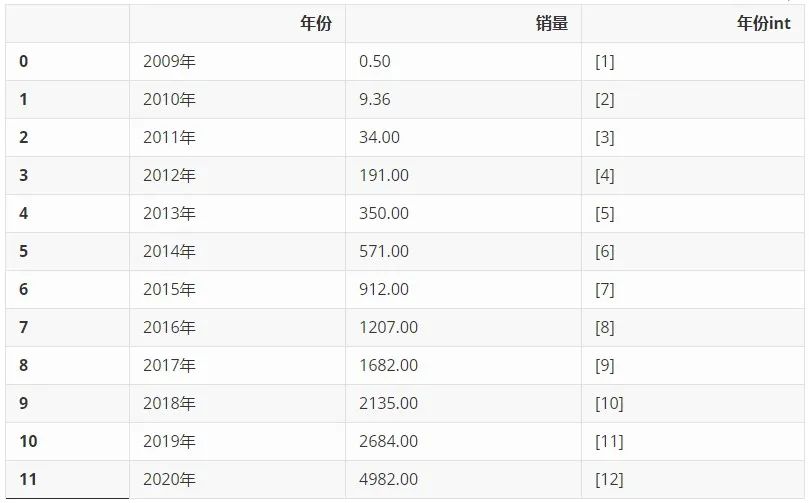
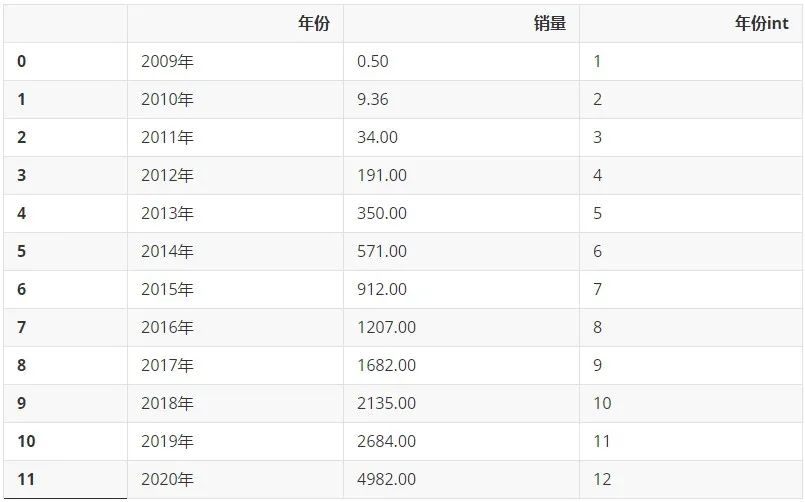
NO.1 统计历年双十一销量数据从网上搜集来历年淘宝天猫双十一销售额数据,单位为亿元,利用 Pandas 整理成 Dataframe,又添加了一列'年份int',留作后续的计算使用。
import pandas as pd
# 数据为网络收集,历年淘宝天猫双十一销售额数据,单位为亿元,仅做示范
double11_sales = {'2009年': [0.50],
                  '2010年':[9.36],
                  '2011年':[34],
                  '2012年':[191],
                  '2013年':[350],
                  '2014年':[571],
                  '2015年':[912],
                  '2016年':[1207],
                  '2017年':[1682],
                  '2018年':[2135],
                  '2019年':[2684],
                  '2020年':[4982],
                 }
df = pd.DataFrame(double11_sales).T.reset_index()
df.rename(columns={'index':'年份',0:'销量'},inplace=True)
df['年份int'] = [[i] for i in list(range(1,len(df['年份'])+1))]
df
.dataframe tbody tr th {
    vertical-align: top;
}
.dataframe thead th {
    text-align: right;
}
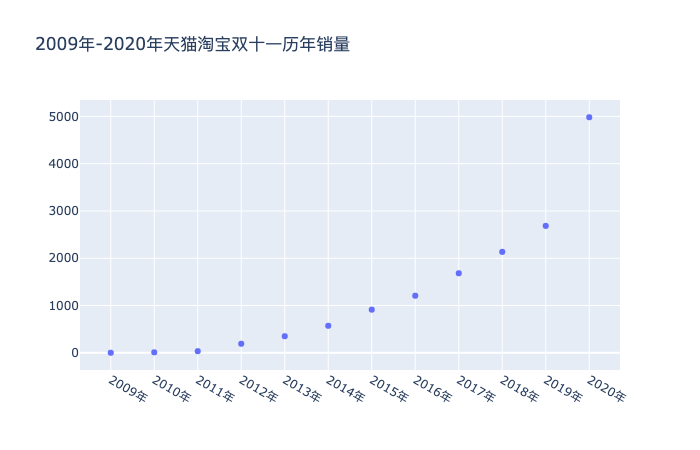
利用 plotly 工具包,将年份对应销售量的散点图绘制出来,可以明显看到2020年的数据立马飙升。
# 散点图
import plotly as py
import plotly.graph_objs as go
import numpy as np
year = df[:]['年份']
sales = df['销量']
trace = go.Scatter(
    x=year,
    y=sales,
    mode='markers'
)
data = [trace]
layout = go.Layout(title='2009年-2020年天猫淘宝双十一历年销量')
fig = go.Figure(data=data, layout=layout)
fig.show()
一元多次线性回归
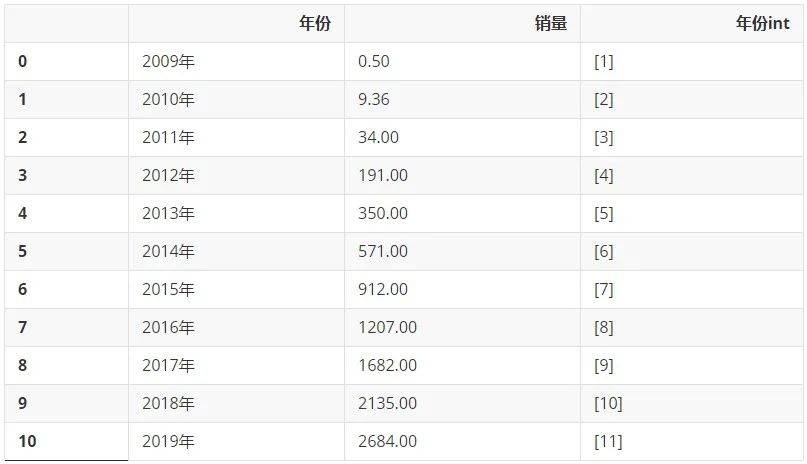
我们先来回顾一下2009-2019年的数据多么美妙。先只选取2009-2019年的数据:
df_2009_2019 = df[:-1]
df_2009_2019
.dataframe tbody tr th {
    vertical-align: top;
}
.dataframe thead th {
    text-align: right;
}
通过以下代码生成二次项数据:
from sklearn.preprocessing import PolynomialFeatures
poly_reg = PolynomialFeatures(degree=2)
X_ = poly_reg.fit_transform(list(df_2009_2019['年份int']))
1.第一行代码引入用于增加一个多次项内容的模块 PolynomialFeatures
2.第二行代码设置最高次项为二次项,为生成二次项数据(x平方)做准备
3.第三行代码将原有的X转换为一个新的二维数组X_,该二维数据包含新生成的二次项数据(x平方)和原有的一次项数据(x)
X_ 的内容为下方代码所示的一个二维数组,其中第一列数据为常数项(其实就是X的0次方),没有特殊含义,对分析结果不会产生影响;第二列数据为原有的一次项数据(x);第三列数据为新生成的二次项数据(x的平方)。
X_
array([[  1.,   1.,   1.],
       [  1.,   2.,   4.],
       [  1.,   3.,   9.],
       [  1.,   4.,  16.],
       [  1.,   5.,  25.],
       [  1.,   6.,  36.],
       [  1.,   7.,  49.],
       [  1.,   8.,  64.],
       [  1.,   9.,  81.],
       [  1.,  10., 100.],
       [  1.,  11., 121.]])
from sklearn.linear_model import LinearRegression
regr = LinearRegression()
regr.fit(X_,list(df_2009_2019['销量']))
LinearRegression()
1.第一行代码从 Scikit-Learn 库引入线性回归的相关模块 LinearRegression;
2.第二行代码构造一个初始的线性回归模型并命名为 regr;
3.第三行代码用fit() 函数完成模型搭建,此时的regr就是一个搭建好的线性回归模型。
NO.4 模型预测接下来就可以利用搭建好的模型 regr 来预测数据。加上自变量是12,那么使用 predict() 函数就能预测对应的因变量有,代码如下:
XX_ = poly_reg.fit_transform([[12]])
XX_
array([[ 1., 12., 144.]])
y = regr.predict(XX_)
y
array([3282.23478788])
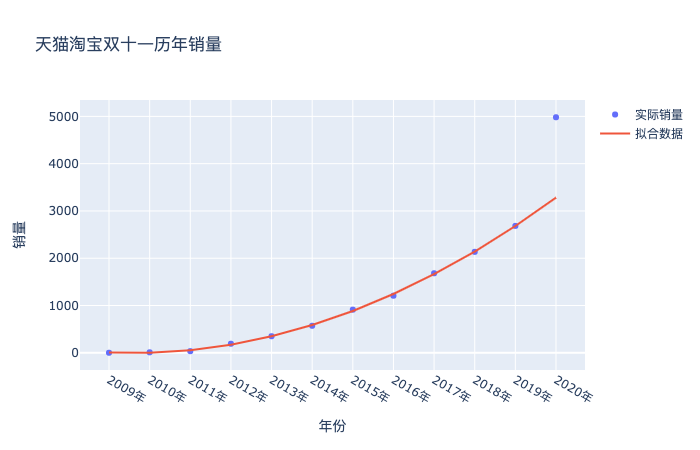
这里我们就得到了如果按照这个趋势2009-2019的趋势预测2020的结果,就是3282,但实际却是4982亿,原因就是上文提到的合并计算了,金额一下子变大了,绘制成图,就是下面这样:
# 散点图
import plotly as py
import plotly.graph_objs as go
import numpy as np
year = list(df['年份'])
sales = df['销量']
trace1 = go.Scatter(
    x=year,
    y=sales,
    mode='markers',
    name="实际销量"       # 第一个图例名称
)
XX_ = poly_reg.fit_transform(list(df['年份int'])+[[13]])
regr = LinearRegression()
regr.fit(X_,list(df_2009_2019['销量']))
trace2 = go.Scatter(
    x=list(df['年份']),
    y=regr.predict(XX_),
    mode='lines',
    name="拟合数据",  # 第2个图例名称
)
data = [trace1,trace2]
layout = go.Layout(title='天猫淘宝双十一历年销量',
                    xaxis_title='年份',
                    yaxis_title='销量')
fig = go.Figure(data=data, layout=layout)
fig.show()
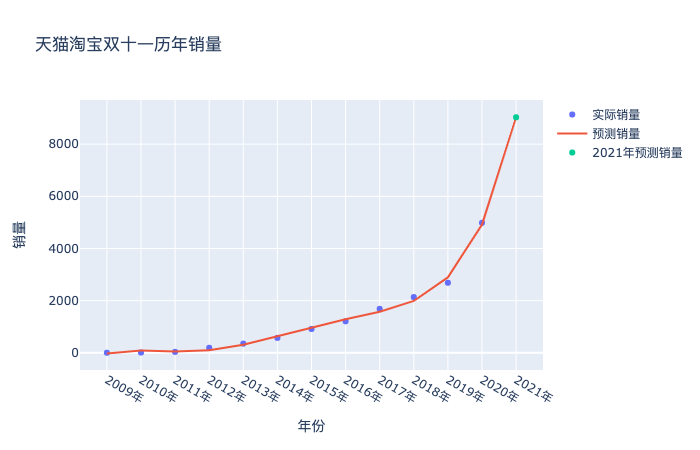
既然数据发生了巨大的偏离,咱们也别深究了,就大力出奇迹。同样的方法,把2020年的真实数据纳入进来,二话不说拟合一样,看看会得到什么结果:
from sklearn.preprocessing import PolynomialFeatures
poly_reg = PolynomialFeatures(degree=5)
X_ = poly_reg.fit_transform(list(df['年份int']))
## 预测2020年
regr = LinearRegression()
regr.fit(X_,list(df['销量']))
LinearRegression()
XXX_ = poly_reg.fit_transform(list(df['年份int'])+[[13]])
# 散点图
import plotly as py
import plotly.graph_objs as go
import numpy as np
year = list(df['年份'])
sales = df['销量']
trace1 = go.Scatter(
    x=year+['2021年','2022年','2023年'],
    y=sales,
    mode='markers',
    name="实际销量"       # 第一个图例名称
)
trace2 = go.Scatter(
    x=year+['2021年','2022年','2023年'],
    y=regr.predict(XXX_),
    mode='lines',
    name="预测销量"       # 第一个图例名称
)
trace3 = go.Scatter(
    x=['2021年'],
    y=[regr.predict(XXX_)[-1]],
    mode='markers',
    name="2021年预测销量"       # 第一个图例名称
)
data = [trace1,trace2,trace3]
layout = go.Layout(title='天猫淘宝双十一历年销量',
                    xaxis_title='年份',
                    yaxis_title='销量')
fig = go.Figure(data=data, layout=layout)
fig.show()
在选择模型中的次数方面,可以通过设置程序,循环计算各个次数下预测误差,然后再根据结果反选参数。
df_new = df.copy()
df_new['年份int'] = df['年份int'].apply(lambda x: x[0])
df_new
.dataframe tbody tr th {
    vertical-align: top;
}
.dataframe thead th {
    text-align: right;
}
#  多项式回归预测次数选择
# 计算 m 次多项式回归预测结果的 MSE 评价指标并绘图
from sklearn.pipeline import make_pipeline
from sklearn.metrics import mean_squared_error
train_df = df_new[:int(len(df)*0.95)]
test_df = df_new[int(len(df)*0.5):]
# 定义训练和测试使用的自变量和因变量
train_x = train_df['年份int'].values
train_y = train_df['销量'].values
# print(train_x)
test_x = test_df['年份int'].values
test_y = test_df['销量'].values
train_x = train_x.reshape(len(train_x),1)
test_x = test_x.reshape(len(test_x),1)
train_y = train_y.reshape(len(train_y),1)
mse = [] # 用于存储各最高次多项式 MSE 值
m = 1 # 初始 m 值
m_max = 10 # 设定最高次数
while m <= m_max:
    model = make_pipeline(PolynomialFeatures(m, include_bias=False), LinearRegression())
    model.fit(train_x, train_y) # 训练模型
    pre_y = model.predict(test_x) # 测试模型
    mse.append(mean_squared_error(test_y, pre_y.flatten())) # 计算 MSE
    m = m + 1
print("MSE 计算结果: ", mse)
# 绘图
plt.plot([i for i in range(1, m_max + 1)], mse, 'r')
plt.scatter([i for i in range(1, m_max + 1)], mse)
# 绘制图名称等
plt.title("MSE of m degree of polynomial regression")
plt.xlabel("m")
plt.ylabel("MSE")
MSE 计算结果: [1088092.9621201046, 481951.27857828484, 478840.8575107471, 477235.9140442428, 484657.87153138855, 509758.1526412842, 344204.1969956556, 429874.9229308078, 8281846.231771571, 146298201.8473966]
Text(0, 0.5, 'MSE')

从误差结果可以看到,次数取2到8误差基本稳定,没有明显的减少了,但其实你试试就知道,次数选择3的时候,预测的销量是6213亿元,次数选择5的时候,预测的销量是9029亿元,对于销售量来说,这个范围已经够大的了。我也就斗胆猜到9029亿元,我的胆量也就预测到这里了,破万亿就太夸张了,欢迎胆子大的同学留下你们的预测结果,让我们11月11日,拭目以待吧。
NO.7 总结最后希望这篇文章带着对 Python 的多项式回归和 Plotly可视化绘图还不熟悉的同学一起练习一下。
欢迎转载、收藏、有所收获点赞支持一下!

以上就是据Python爬虫不靠谱预测可知今年双十一销售额将超过6000亿元的详细内容,更多关于Python 爬虫预测的资料请关注软件开发网其它相关文章!