Python可视化神器pyecharts绘制水球图
目录
水球图
双水球图显示
正方形水球图
圆球水球图
数据精度水球图
炫酷水球超级好看
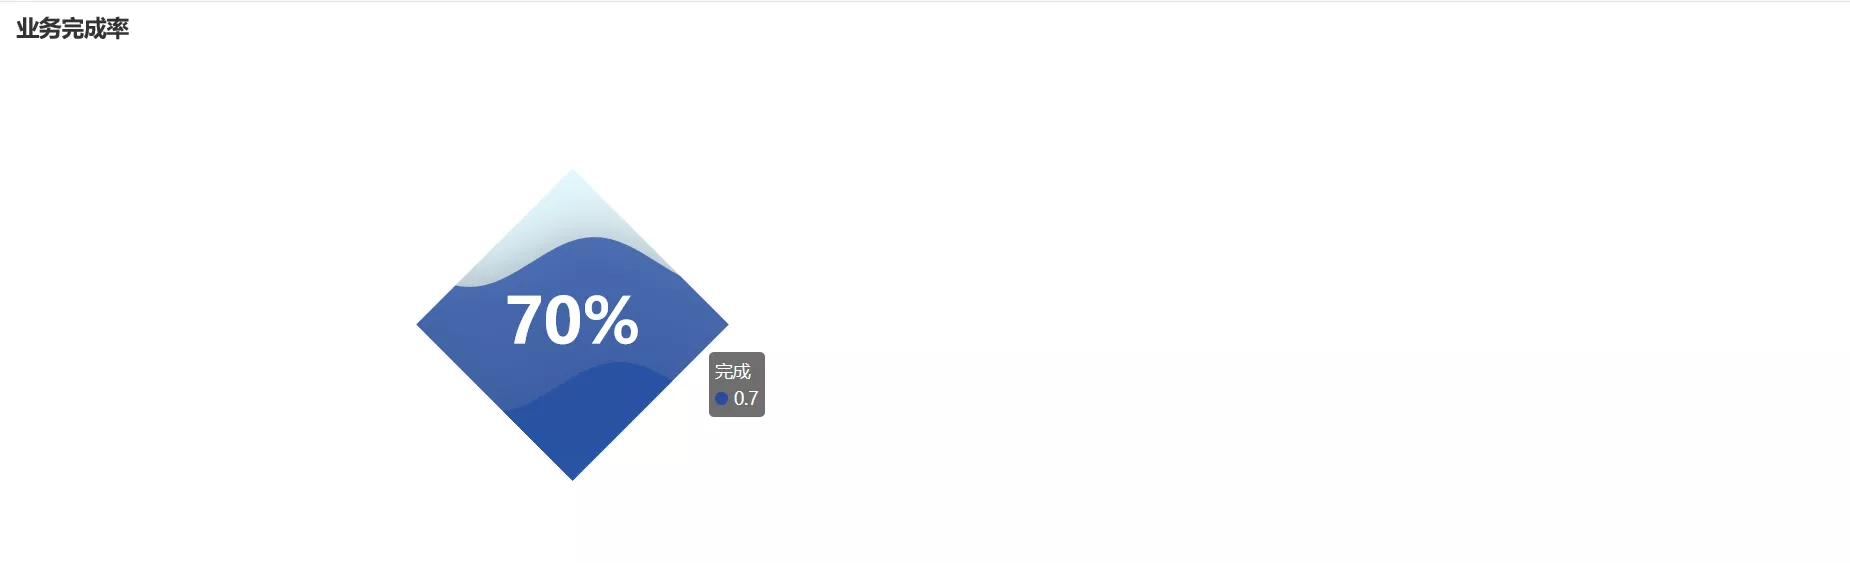
水球图水球图首先是动态的效果,像水流一样波动,所以看起来比较的舒服,一般用于业务里面的完成率,其实和之前的仪表盘有点类似,但是我个人绝对水球图更加的好,因为看起来比较的炫酷。
from pyecharts import options as opts
from pyecharts.charts import Liquid
from pyecharts.globals import SymbolType
c = (
Liquid()
.add("完成", [0.7, 0.3], is_outline_show=False, shape=SymbolType.DIAMOND)
.set_global_opts(title_opts=opts.TitleOpts(title="业务完成率"))
.render("菱形水球图.html")
)
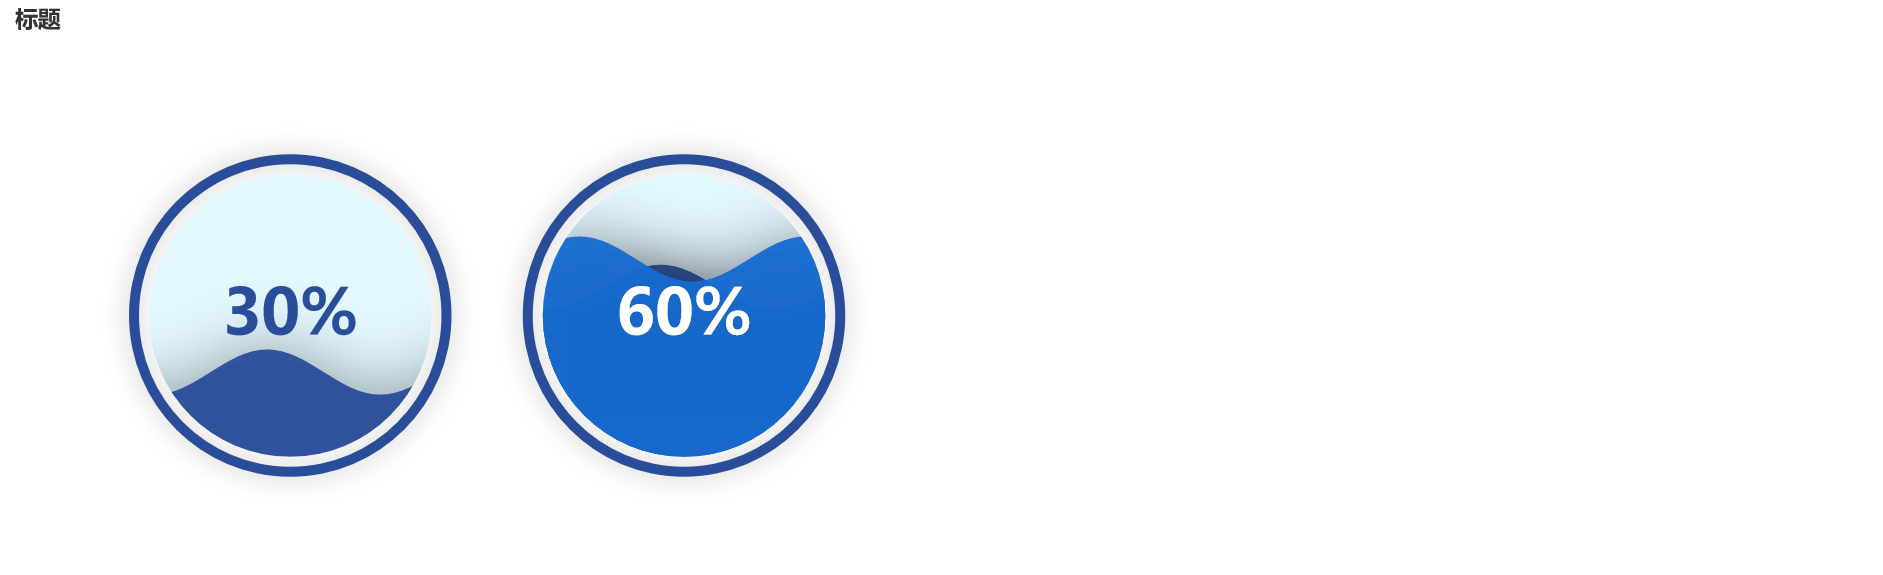
from pyecharts import options as opts
from pyecharts.charts import Grid, Liquid
from pyecharts.commons.utils import JsCode
l1 = (
Liquid()
.add("lq", [0.6, 0.7], center=["60%", "50%"])
.set_global_opts(title_opts=opts.TitleOpts(title="标题"))
)
l2 = Liquid().add(
"lq",
[0.3],
center=["25%", "50%"],
label_opts=opts.LabelOpts(
font_size=50,
formatter=JsCode(
"""function (param) {
return (Math.floor(param.value * 10000) / 100) + '%';
}"""
),
position="inside",
),
)
grid = Grid().add(l1, grid_opts=opts.GridOpts()).add(l2, grid_opts=opts.GridOpts())
grid.render("双水球图显示.html")
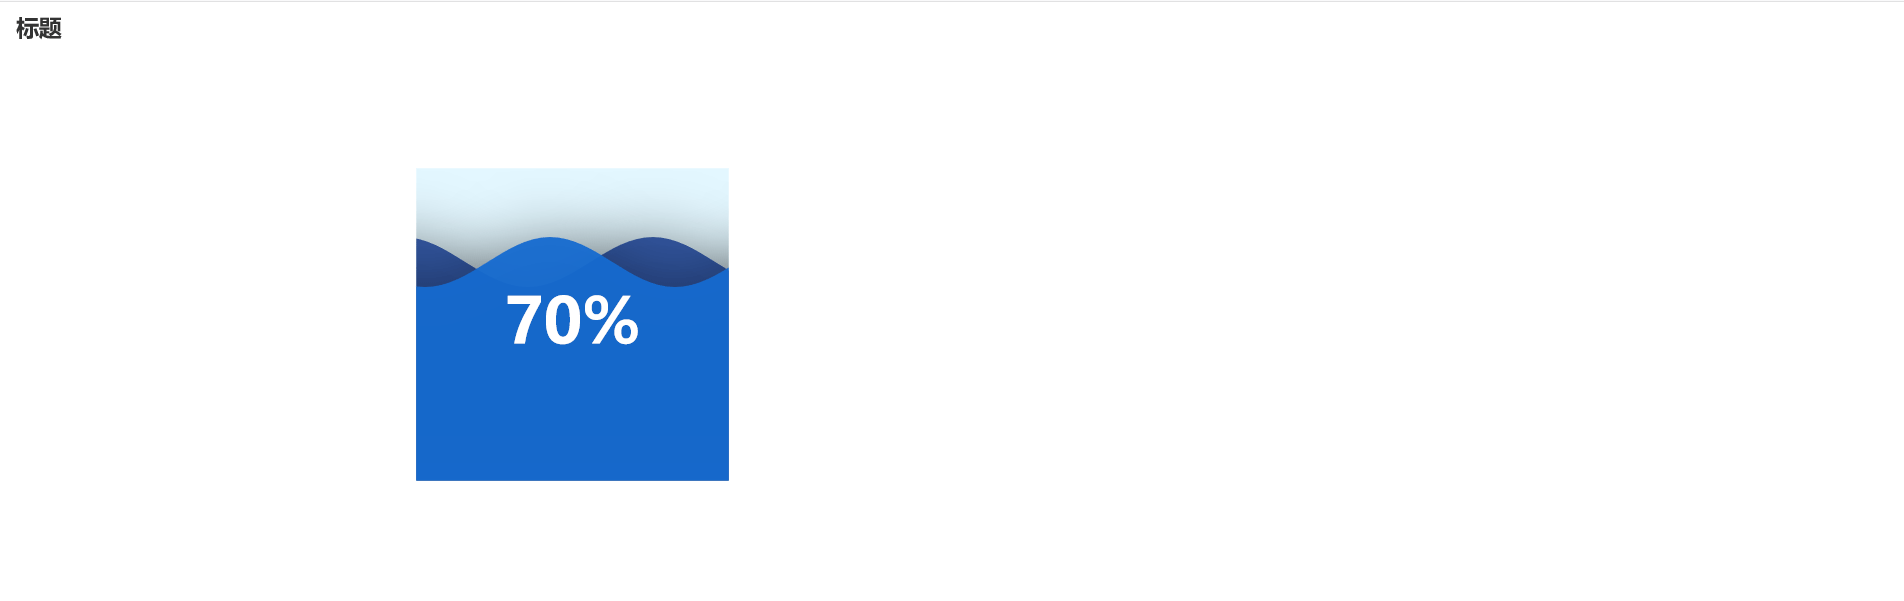
其实只需要变动一下参数即可,和最开始的那个差不多。
from pyecharts import options as opts
from pyecharts.charts import Liquid
from pyecharts.globals import SymbolType
c = (
Liquid()
.add("lq", [0.7, 0.7], is_outline_show=False, shape=SymbolType.RECT)
.set_global_opts(title_opts=opts.TitleOpts(title="标题"))
.render("正方形.html")
)
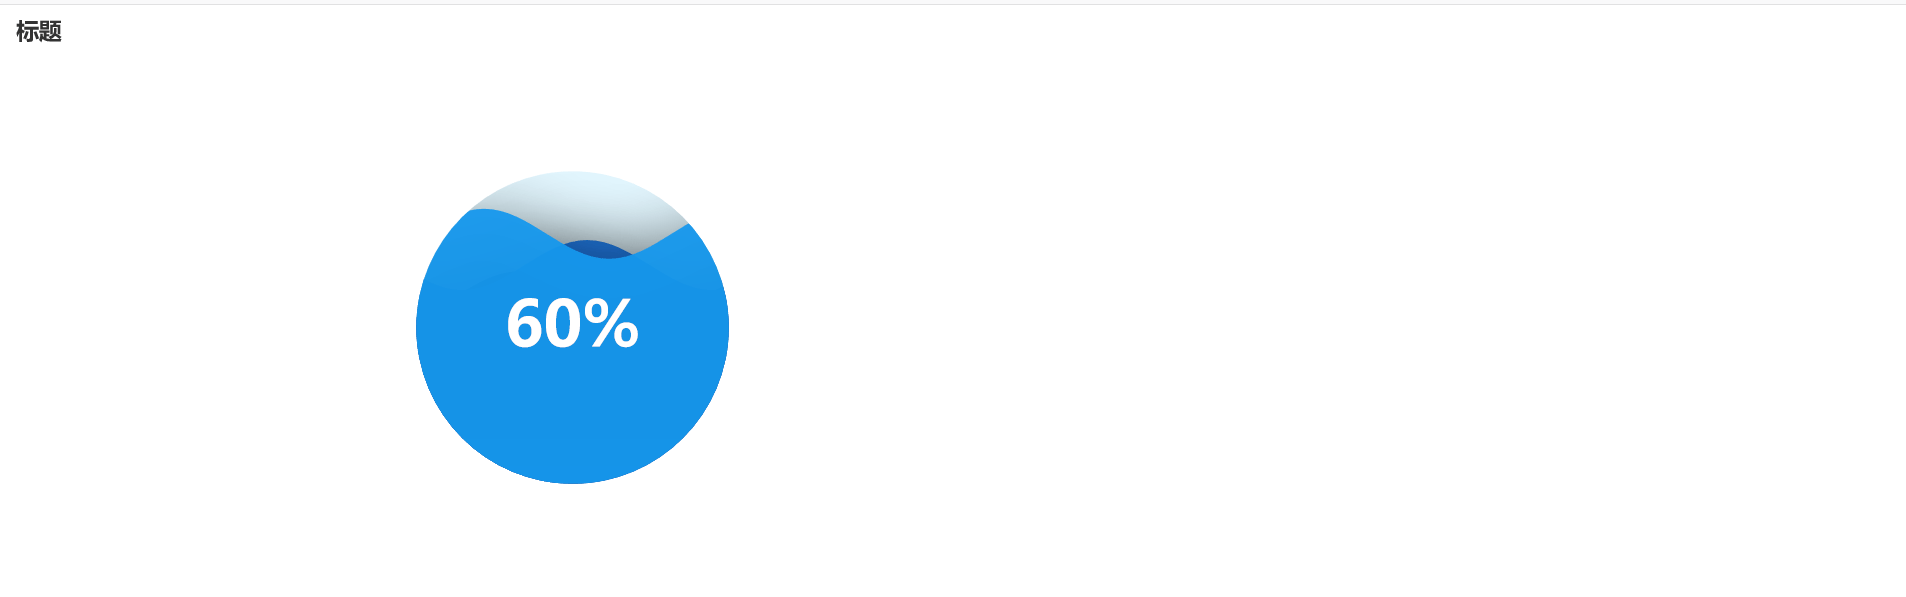
from pyecharts import options as opts
from pyecharts.charts import Liquid
c = (
Liquid()
.add("lq", [0.7, 0.7])
.set_global_opts(title_opts=opts.TitleOpts(title="圆球"))
.render("圆球.html")
)

from pyecharts import options as opts
from pyecharts.charts import Liquid
from pyecharts.commons.utils import JsCode
c = (
Liquid()
.add(
"lq",
[0.3254],
label_opts=opts.LabelOpts(
font_size=50,
formatter=JsCode(
"""function (param) {
return (Math.floor(param.value * 10000) / 100) + '%';
}"""
),
position="inside",
),
)
.set_global_opts(title_opts=opts.TitleOpts(title="标题"))
.render("数据精度水球图.html")
)

感觉这个颜色搭配还是不错的
from pyecharts import options as opts
from pyecharts.charts import Liquid
c = (
Liquid()
.add("lq", [0.6, 0.7, 0.8], is_outline_show=False)
.set_global_opts(title_opts=opts.TitleOpts(title="标题"))
.render("无边框水球图.html")
)
到此这篇关于Python可视化神器pyecharts绘制水球图的文章就介绍到这了,更多相关 Python绘制水球图内容请搜索软件开发网以前的文章或继续浏览下面的相关文章希望大家以后多多支持软件开发网!