【量化】4天学会python机器学习与量化交易-笔记2(p16~p20)
平台:https://www.ricequant.com/quant/#?tag=algorithm-ol&id=1339040
api1:https://www.ricequant.com/doc/rqdata-institutional#research-API-get_fundamentals
api2:https://www.ricequant.com/doc/api/python/chn#wizard-stock
多读书,多看“报”(证券研究报告)

视频:https://www.bilibili.com/video/av55456917?p=17
代码:
def init(context):
	context.hs300 = index_components("000300.XSHG")
# before_trading此函数会在每天策略交易开始前被调用,当天只会被调用一次
def before_trading(context):
    # 获取过滤的股票
    q = query(
        fundamentals.eod_derivative_indicator.market_cap
    ).order_by(
        fundamentals.eod_derivative_indicator.market_cap
    ).filter(
        fundamentals.stockcode.in_(context.hs300)
    ).limit(20)
    funds = get_fundamentals(q)
    # 获得10只股票的名字
    context.stock_list = funds.T.index
def handle_bar(context, bar_dict):
    # 卖出
    # 去positions里面获取仓位
    for stock in context.portfolio.positions.keys():
        if stock not in context.stock_list:
            order_target_percent(stock, 0)
    # 买入
    for stock in context.stock_list:
        order_target_percent(stock, 1.0/20)
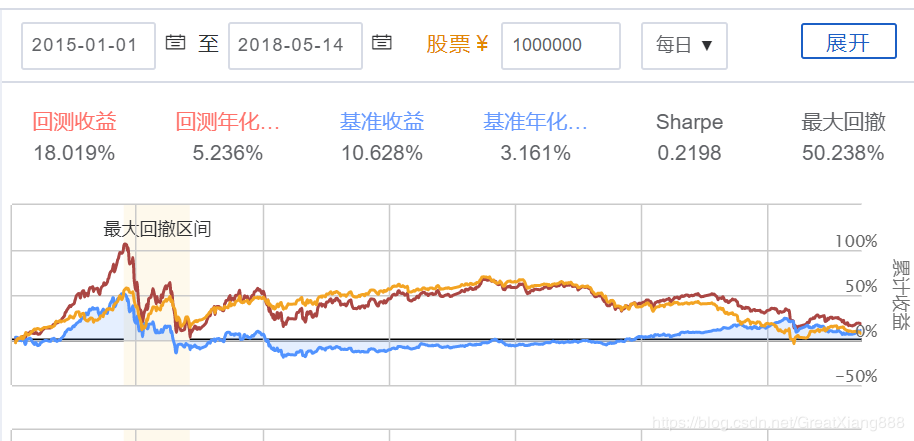
结果:
视频:https://www.bilibili.com/video/av55456917?p=18
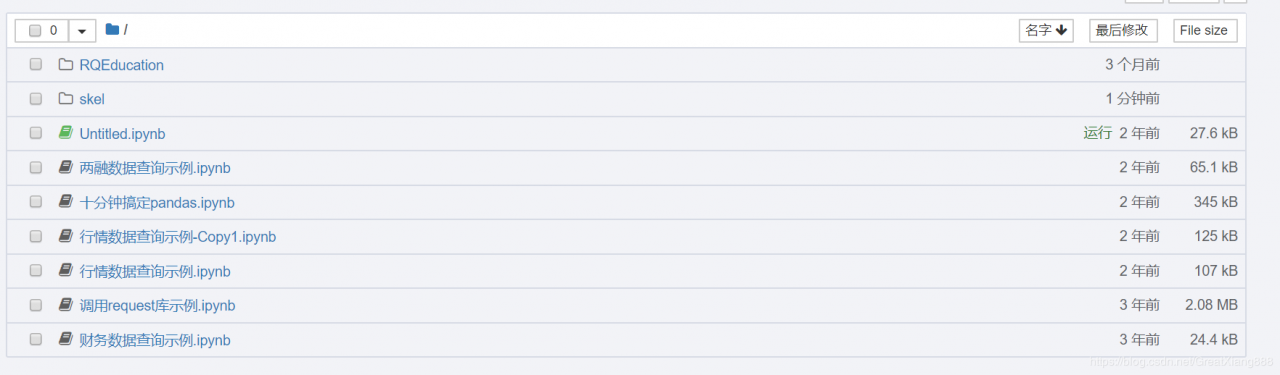
notebook位置:https://www.ricequant.com/research/user/user_358930/tree?
(原来以为功能被删了,后来直接输入网址找到了)
(两年前玩过一会这个,可是基础太差直接放弃了。一转眼研究生都快读完了,重新拾起,这个方向肯定是我要研究的,给自己一个期限,看5年后是否能有所建树。)
1,研究平台api
get_price(“000001.XSHE”, start_date=“2017-01-01”, end_date=“2017-01-06”) #一只股票 get_price([“000001.XSHE”, “000005.XSHE”, “000002.XSHE”], start_date=“2017-01-01”, end_date=“2017-01-06”, fields=“close”) #多只股票 get_trading_dates(start_date=“2017-01-01”, end_date=“2018-01-01”) #获取交易日日期 fund = get_fundamentals(q, entry_date=‘2017-01-03’)# 获取财务数据
q = query(fundamentals.income_statement.revenue,
fundamentals.income_statement.cost_of_goods_sold
).filter(fundamentals.stockcode.in_(['000001.XSHE', '000002.XSHE']))
fund = get_fundamentals(q, entry_date='2017-01-03')
fund
结果:
Dimensions: 2 (items) x 1 (major_axis) x 2 (minor_axis)
Items axis: revenue to cost_of_goods_sold
Major_axis axis: 2017-01-03 00:00:00 to 2017-01-03 00:00:00
Minor_axis axis: 000001.XSHE to 000002.XSHE
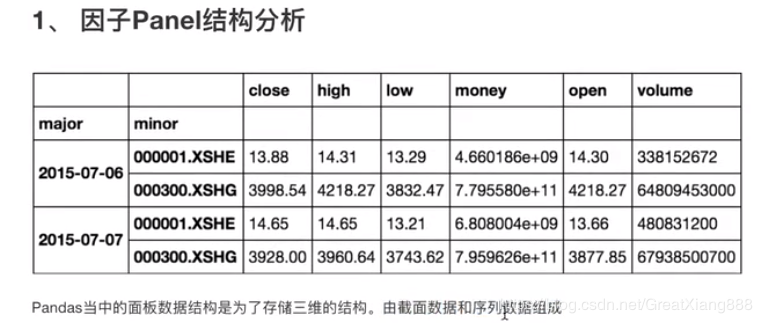
2,数据的组成
 序列数据:不同时间点上收集的数据,反映了某一事物、现象随时间的变化状态或程度
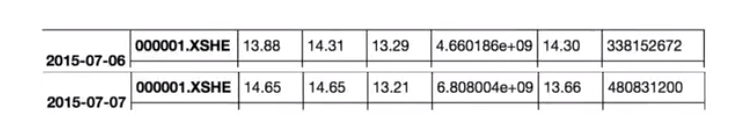 面板数据转换成截面数据
fund[:, ‘2017-01-03’,:]
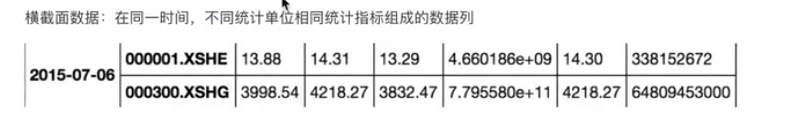
3,多因子数据的处理
多因子分析使用的是截面数据。 因子数据的处理– 并不是去除异常数据,而是拉回到正常值。 三种方法:
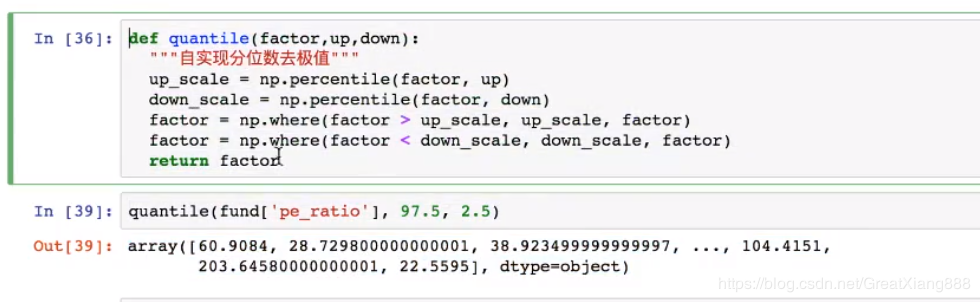
– 分位数去极值:中位数,四分位数,百分位数
– 中位数绝对偏差去极值
– 正态分布去极值 p19 案例:中位数去极值和3背中位数去极值
视频:https://www.bilibili.com/video/av55456917?p=19
四分位数:从小到大排列,排第25%,50%,75%位置的数
指定分位区间以外的数用分位点替换
1,
代码:
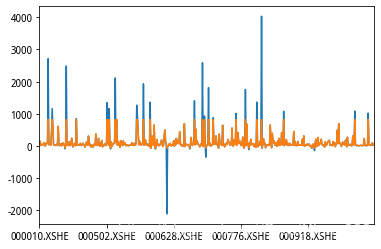
from scipy.stats.mstats import winsorize
# 对pe_ratio进行去极值
fund = get_fundamentals(query(fundamentals.eod_derivative_indicator.pe_ratio), entry_date='20170103')[:, '20170103', :]
fund['pe_ratio_winsorize'] = winsorize(fund['pe_ratio'], limits=0.025)
fund['pe_ratio'][:500].plot()
fund['pe_ratio_winsorize'][:500].plot()
结果:
自实现分位数:
2,中位数绝对偏差去极值
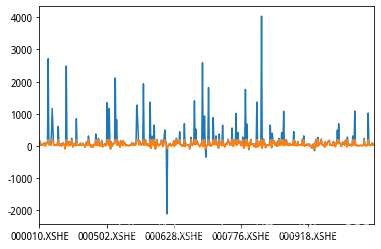
3倍中位数去极值(常用)import numpy as np
def mad(factor):
'''中位数绝对偏差去极值'''
# 1,找出中位数
me = np.median(factor)
# 2,得到每个因子值与中位数的绝对偏差值 |x-median|
# 3,得到绝对偏差的中位数mad = median(|x-median|)
mad = np.median(abs(factor - me))
# 4,计算MAD_e = 1.4826*MAD,然后确定参数n,做出调整
# n取3,表示3倍中位数去极值
# 求出3倍中位数的上下限
up = me + (3* 1.4826* mad)
down = me - (3* 1.4826* mad)
# 利用上下限去极值
factor = np.where(factor>up, up, factor)
factor = np.where(factor<down, down, factor)
return factor
#对pe_ratio去极值
fund['pe_ratio_3md'] = mad(fund['pe_ratio'])
fund['pe_ratio'][:500].plot()
fund['pe_ratio_3md'][:500].plot()
结果:
视频:https://www.bilibili.com/video/av55456917?p=20
(老师说不常用)
代码:
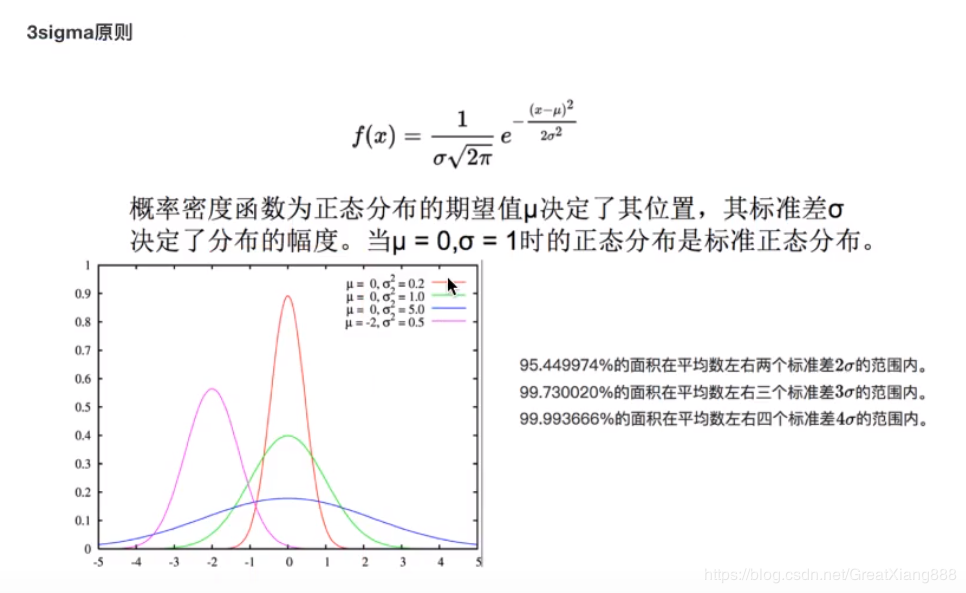
# 3sigma方法去极值
def threesigma(factor):
    # 计算平均值和标准差
    mean = factor.mean()
    std = factor.std()
    # 计算上下限的数据
    up = mean + 3*std
    down = mean - 3*std
    # 替换极值
    factor = np.where(factor>up, up, factor)
    factor = np.where(factor<down, down, factor)
    return factor
#对pe_ratio去极值
fund['pe_ratio_3sigma'] = threesigma(fund['pe_ratio'])
fund['pe_ratio'][:500].plot()
fund['pe_ratio_3sigma'][:500].plot()
结果:

去极值:推荐中位数绝对偏差去极值,其次用分位数。
作者:机智翔学长