python,sklearn,svm,遥感数据分类,代码实例
支持向量机(Support Vector Machine,即SVM)是包括分类(Classification)、回归(Regression)和异常检测(Outlier Detection)等一系列监督学习算法的总称。对于分类,SVM最初用于解决二分类问题,多分类问题可通过构建多个SVM分类器解决。SVM具有两大特点:1.寻求最优分类边界,即求解出能够正确划分训练数据集并且几何间隔最大的分离超平面,这是SVM的基本思想;2.基于核函数的扩维变换,即通过核函数的特征变换对线性不可分的原始数据集进行升维变换,使其线性可分。因此SVM最核心的过程是核函数和参数选择。
(2)svm实现环境解析设置中文输出代码兼容格式及引用的库函数,用于精度评估的库函数,以及svm参数寻优等。
下面展示一些 内联代码片。
 -*- coding: utf-8 -*-
#用于精度评价
from sklearn.metrics import cohen_kappa_score
from sklearn.metrics import accuracy_score
from sklearn.metrics import confusion_matrix
#numpy引用
import numpy as np
#记录运行时间
import datetime
#文件路径操作
import os
#svm and best parameter select using grid search method
from sklearn import svm
from sklearn.model_selection import GridSearchCV
#scale the data to 0-1  用于数据归一化
from sklearn import preprocessing
(3)svm函数参数寻优
SVM参数寻优的实现,有两种常用方法,一种是网格搜索法(本文中的),另一种是使用libsvm工具通过交叉验证实现(后面再写,有兴趣的可以留言)。
def grid_find(train_data_x,train_data_y):
     # 10 is often helpful. Using a basis of 2, a finer.tuning can be achieved but at a much higher cost.
     # logspace(a,b,N),base默认=10,把10的a次方到10的b次方区间分成N份。
	C_range = np.logspace(-5, 9, 8, base=2)
    # 如:C_range = 1/64,1/8,1/2,2,8,32,128,512
    gamma_range = np.logspace(-15, 3, 10, base=2)
    # 选择linear线性核函数和rbf核函数
    parameters = {'kernel': ('linear', 'rbf'), 'C': C_range, 'gamma': gamma_range}
    svr = svm.SVC()
     # n_jobs表示并行运算量,可加快程序运行结果。
     # 此处选择5折交叉验证,10折交叉验证也是常用的。
    clf = GridSearchCV(svr, parameters, cv=5, n_jobs=4)
    # 进行模型训练
    clf.fit(train_data_x, train_data_y)
    print('最优c,g参数为:{0}'.format(clf.best_params_))
    # 返回最优模型结果
    svm_model = clf.best_estimator_
    return svm_model
更多关于网格搜索法:
(4)数据读取函数编写(读取txt格式的训练与测试文件)首先是读取txt格式的训练数据和测试数据的函数。
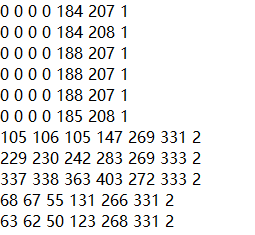
数据截图如下,其中,前6列数据代表通过遥感影像感兴趣区(roi)提取出的6个波段的灰度值,最后一列代表数据类别的标签。

代码如下,仅需输入文件路径即可:
def open_txt_film(filepath):
    # open the film
    if os.path.exists(filepath):
        with open(filepath, mode='r') as f:
            train_data_str = np.loadtxt(f, delimiter=' ')
            print('训练(以及测试)数据的行列数为{}'.format(train_data_str.shape))
            return train_data_str
    else:
        print('输入txt文件路径错误,请重新输入文件路径')
(5)svm模型预测函数编写
输入模型与测试数据,输出精度评估(包括混淆矩阵,制图精度等等)。
def model_process(svm_model, test_data_x, test_data_y):
    p_lable = svm_model.predict(test_data_x)
    # 精确度为 生产者精度  召回率为 用户精度
    print('总体精度为 : {}'.format(accuracy_score(test_data_y, p_lable)))
    print('混淆矩阵为 :\n {}'.format(confusion_matrix(test_data_y, p_lable)))
    print('kappa系数为 :\n {}'.format(cohen_kappa_score(test_data_y, p_lable)))
    matric = confusion_matrix(test_data_y, p_lable)
    # output the accuracy of each category。由于类别标签是从1开始的,因此明确数据中最大值,即可知道有多少类
    for category in range(np.max(test_data_y)):
        # add 0.0 to keep the float type of output
        precise = (matric[category, category] + 0.0) / np.sum(matric[category, :])
        recall = (matric[category, category] + 0.0) / np.sum(matric[:, category])
        f1_score = 2 * (precise * recall) / (recall + precise)
        print(
            '类别{}的生产者、制图(recall)精度为{:.4}  用户(precision)精度为{:.4}  F1 score 为{:.4} '.format(category + 1, precise, recall, f1_score))
(6)主函数编写
主函数主要负责:读取数据,预处理数据,以及参数寻优、模型训练和模型预测。
针对不同的数据集,每次使用,仅仅需要修改训练与测试数据的路径即可。
def main():
    # read the train data from txt film
    train_file_path = r'E:\CSDN\data1\train.txt'
    train_data = open_txt_film(train_file_path)
    # read the predict data from txt film
    test_file_path = r'E:\CSDN\data1\test.txt'
    test_data = open_txt_film(test_file_path)
     # data normalization for svm training and testing dataset
    scaler = preprocessing.MinMaxScaler().fit(train_data[:, :-1])
    train_data[:, :-1] = scaler.transform(train_data[:, :-1])
    # keep the same scale of the train data
    test_data[:, :-1] = scaler.transform(test_data[:, :-1])
    # conversion the type of data,and the label's dimension to 1-d
    train_data_y = train_data[:, -1:].astype('int')
    train_data_y = train_data_y.reshape(len(train_data_y))
    train_data_x = train_data[:, :-1]
    # 取出测试数据灰度值和标签值,并将2维标签转为1维
    test_data_x = test_data[:, :-1]
    test_data_y = test_data[:, -1:].astype('int')
    test_data_y = test_data_y.reshape(len(test_data_y))
    model = grid_find(train_data_x,train_data_y)
    # 模型预测
    model_process(model, test_data_x, test_data_y)
(7)调用主函数
这里新增了几行代码用于记录程序运行时间。
if __name__ == "__main__":
    # remember the beginning time of the program
    start_time = datetime.datetime.now()
    print("start...%s" % start_time)
    main()
    # record the running time of program with the unit of minutes
    end_time = datetime.datetime.now()
    last_time = (end_time - start_time).seconds / 60
    print("The program is last %s" % last_time + " minutes")
    # print("The program is last {} seconds".format(last_time))
(8)训练数据与测试数据实例下载地址
数据在作者的github仓库下,共两个文件(train.txt 和 test.txt) 。
[下载链接]: (https://github.com/sunzhihu123/sunzhihu123.github.io)
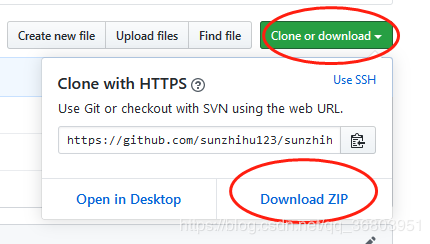
仓库下点击下载即可,如图:

==本文优点:仅有两个输入,一个是训练数据的路径,一个是测试数据的路径,轻松上手;并且以遥感图像数据为例。另外github将会整体上传源码哦~
作者:huhu_xq