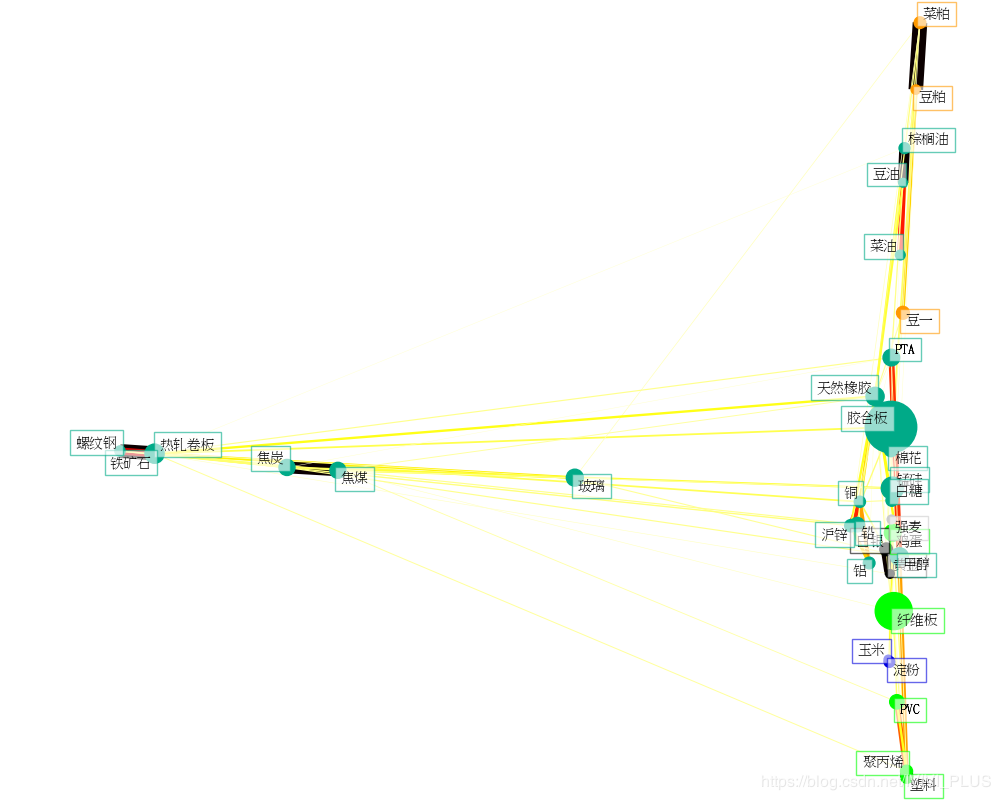
Python+MYSQL+SKLearn对国内商品期货聚类
参考了SKLearn官网上的示例Visualizing the stock market structure
结果如图:
sudo apt install mysql-server
sudo mysql
sudo打开mysql后创建名为ClusteringFutures的数据库,并创建和授权一般用户。Ctrl+c退出
CREATE DATABASE ClusteringFutures;
USE ClusteringFutures;
CREATE USER 'IVIVI_PLUS'@'localhost' IDENTIFIED BY '123456';
GRANT ALL PRIVILEGES ON ClusteringFutures.* TO 'IVIVI_PLUS'@'localhost';
FLUSH PRIVILEGES;
验证以上操作,以一般用户进入数据库。
mysql -u IVIVI_PLUS -p ClusteringFutures
至此,MYSQL准备工作完成。
Python端基本流程:
1、从新浪财经获取国内商品期货的日K线数据。
2、数据导入MYSQL
3、清洗数据
4、计算单日涨跌幅,作为聚类模型训练的输入
5、SKLearn聚类
6、Matplotlib进行可视化
import requests
import pymysql
import numpy as np
import matplotlib.pyplot as plt
from matplotlib.collections import LineCollection
from sklearn import cluster, covariance, manifold
# 商品期货代码与名称字典
# symbol_dict = {
#     'TA0': 'PTA',
#     'OI0': '菜油',
#     'RS0': '菜籽',
#     'RM0': '菜粕',
#     'ZC0': '动力煤',
#     'WH0': '强麦',
#     'JR0': '粳稻',
#     'SR0': '白糖',
#     'CF0': '棉花',
#     'RI0': '早籼稻',
#     'MA0': '甲醇',
#     'FG0': '玻璃',
#     'LR0': '晚籼稻',
#     'SF0': '硅铁',
#     'SM0': '锰硅',
#     'CY0': '棉纱',
#     'AP0': '苹果',
#     'CJ0': '红枣',
#     'V0': 'PVC',
#     'P0': '棕榈油',
#     'B0': '豆二',
#     'M0': '豆粕',
#     'I0': '铁矿石',
#     'JD0': '鸡蛋',
#     'L0': '塑料',
#     'PP0': '聚丙烯',
#     'FB0': '纤维板',
#     'BB0': '胶合板',
#     'Y0': '豆油',
#     'C0': '玉米',
#     'A0': '豆一',
#     'J0': '焦炭',
#     'JM0': '焦煤',
#     'CS0': '淀粉',
#     'EG0': '乙二醇',
#     'FU0': '燃料油',
#     'SC0': '上海原油',
#     'AL0': '铝',
#     'RU0': '天然橡胶',
#     'ZN0': '沪锌',
#     'CU0': '铜',
#     'AU0': '黄金',
#     'RB0': '螺纹钢',
#     'WR0': '线材',
#     'PB0': '铅',
#     'AG0': '白银',
#     'BU0': '沥青',
#     'HC0': '热轧卷板',
#     'SN0': '锡',
#     'NI0': '镍',
#     'SP0': '纸浆'}
symbol_dict = {
    'TA0': 'PTA',
    'OI0': '菜油',
    'RM0': '菜粕',
    'WH0': '强麦',
    'SR0': '白糖',
    'CF0': '棉花',
    'MA0': '甲醇',
    'FG0': '玻璃',
    'SM0': '锰硅',
    'V0': 'PVC',
    'P0': '棕榈油',
    'M0': '豆粕',
    'I0': '铁矿石',
    'JD0': '鸡蛋',
    'L0': '塑料',
    'PP0': '聚丙烯',
    'FB0': '纤维板',
    'BB0': '胶合板',
    'Y0': '豆油',
    'C0': '玉米',
    'A0': '豆一',
    'J0': '焦炭',
    'JM0': '焦煤',
    'CS0': '淀粉',
    'AL0': '铝',
    'RU0': '天然橡胶',
    'ZN0': '沪锌',
    'CU0': '铜',
    'AU0': '黄金',
    'RB0': '螺纹钢',
    'PB0': '铅',
    'AG0': '白银',
    'HC0': '热轧卷板'}
# 将期货字典的keys和values排序后,分别存入symbol_list和names备用
symbol_list, names = np.array(sorted(symbol_dict.items())).T
# 将symbol从np.array转为list
symbol_list = list(symbol_list)
# 创建期货数据表的函数
def creat_future_table(symbol):
    future_code = symbol
    # 向新浪财经api请求历史数据
    url_str = ('http://stock2.finance.sina.com.cn/futures/api/json.php/IndexService.getInnerFuturesDailyKLine?symbol=' +
               future_code)
    r = requests.get(url_str)
    daily_klines = r.json()
    daily_klines_lists = list(daily_klines)
    # 数据写入数据库,表格名为期货代码
    future_db = pymysql.connect('localhost', 'IVIVI_PLUS', '123456', 'ClusteringFutures')
    cursor = future_db.cursor()
    # 如果已存在该期货表格,则删除
    cursor.execute("DROP TABLE IF EXISTS " + future_code)
    # 创建表格,“交易日期”(主键)、开盘价、最高价、最低价、收盘价、成交量
    sql = "CREATE TABLE " + future_code + """ (
             price_date DATE NOT NULL PRIMARY KEY,
             open_price DECIMAL(19, 4),
             high_price DECIMAL(19, 4),
             low_price DECIMAL(19, 4),
             close_price DECIMAL(19, 4),
             volume BIGINT)"""
    # 运行创建表格的sql语句
    cursor.execute(sql)
    # 插入数据(ps:新浪api返回数据转字符串时会多余'['和']',所以进行切片)
    for i in daily_klines_lists:
        sql = "INSERT INTO " + future_code + """ (price_date, open_price, high_price, low_price, close_price, volume)
               VALUES (""" + str(i)[1:-1] + ")"
        try:
            # 执行sql语句
            cursor.execute(sql)
            # 提交到数据库执行
            future_db.commit()
        except:
            print('rollback table %s' %s (future_code))
            # 如果发生错误则回滚
            future_db.rollback()
    # 关闭数据库连接
    future_db.close()
# 删除表格中垃圾数据行的函数
def delete_rows(symbol):
    future_code = symbol
    future_db = pymysql.connect('localhost', 'IVIVI_PLUS', '123456', 'ClusteringFutures')
    cursor = future_db.cursor()
    # 简单认为,开盘价或收盘价或成交量是0的行为垃圾数据
    sql = "DELETE FROM " + future_code + " WHERE open_price = 0 OR close_price = 0 OR volume = 0"
    cursor.execute(sql)
    future_db.commit()
    future_db.close()
# 返回一个表格中,全部交易日期的函数
def select_columns(symbol):
    future_code = symbol
    future_db = pymysql.connect('localhost', 'IVIVI_PLUS', '123456', 'ClusteringFutures')
    cursor = future_db.cursor()
    sql = "SELECT price_date FROM " + future_code
    cursor.execute(sql)
    r = cursor.fetchall()
    future_db.close()
    return r
# 查询某期货某一天的某项数据的函数
def select_a_data(symbol, date, data_name):
    future_code = symbol
    future_db = pymysql.connect('localhost', 'IVIVI_PLUS', '123456', 'ClusteringFutures')
    cursor = future_db.cursor()
    sql = "SELECT %s FROM " % data_name + future_code + " WHERE price_date = \'" + date + "\'"
    cursor.execute(sql)
    r = cursor.fetchall()
    future_db.close()
    return r
print('对 %d 只期货进行聚类' % len(symbol_list))
# 对symbol_list中的所有期货创建数据表,并删除垃圾行
for s in symbol_list:
    print(symbol_dict[s])
    creat_future_table(s)
    delete_rows(s)
# 找出symbol_list中的所有期货的共有交易日
date_set_list = []  # 交易日组成的集合的列表(为了方便后续的求交集工作,所以转为集合)
for s in symbol_list:
    r = select_columns(s)
    date_set_list.append(set(r))
com_date_set = date_set_list[0]  # 共有交易日集合,初始等于第一支期货的交易日集合
# 对date_set_list中的全部日期集合求交集,获得共有交易日
for i in range(len(symbol_list)):
    com_date_set = com_date_set.intersection(date_set_list[i])
com_date_list = list(com_date_set)
com_date_list.sort()
# 将共有交易日以字符串形式保存,方便后续使用
str_com_date_list = []
for i in com_date_list:
    str_com_date_list.append(str(i[0]))
# 打印共有交易日天数
print('将要聚类的期货共有 %d 条有效交易数据' % len(str_com_date_list))
# 将共有交易日的收盘价和开盘价转为np.array格式
# 转置后每一列是同一个期货每个交易日的收盘价或开盘价
# 行数为交易日天数,列数为期货数量
close_prices_list = []
for s in symbol_list:
    tmp_list = []
    for date in str_com_date_list:
        tmp_list.append(select_a_data(s, date, 'close_price')[0][0])
    else:
        close_prices_list.append(tmp_list)
close_prices = np.array(close_prices_list).T
open_prices_list = []
for s in symbol_list:
    tmp_list = []
    for date in str_com_date_list:
        tmp_list.append(select_a_data(s, date, 'open_price')[0][0])
    else:
        open_prices_list.append(tmp_list)
open_prices = np.array(open_prices_list).T
# 计算每个期货的每个单日涨跌幅数组作为模型输入
X = (close_prices - open_prices) / open_prices * 100
# 查看输入形状
print('验证输入数据形状')
print(X.shape)
# 使用sk_learn预设模型进行聚类
edge_model = covariance.GraphicalLassoCV()
edge_model.fit(X)
_, labels = cluster.affinity_propagation(edge_model.covariance_)
n_labels = labels.max()
# #############################################################################
# Find a low-dimension embedding for visualization: find the best position of
# the nodes (the stocks) on a 2D plane
# We use a dense eigen_solver to achieve reproducibility (arpack is
# initiated with random vectors that we don't control). In addition, we
# use a large number of neighbors to capture the large-scale structure.
node_position_model = manifold.LocallyLinearEmbedding(
    n_components=2, eigen_solver='dense', n_neighbors=6)
embedding = node_position_model.fit_transform(X.T).T
# #############################################################################
# Visualization
plt.rcParams['font.sans-serif'] = ['TW-Sung']  # 指定中文字体,解决中文乱码
plt.figure(1, facecolor='w', figsize=(10, 8))
plt.clf()
ax = plt.axes([0., 0., 1., 1.])
plt.axis('off')
# Display a graph of the partial correlations
partial_correlations = edge_model.precision_.copy()
d = 1 / np.sqrt(np.diag(partial_correlations))
partial_correlations *= d
partial_correlations *= d[:, np.newaxis]
non_zero = (np.abs(np.triu(partial_correlations, k=1)) > 0.02)
# Plot the nodes using the coordinates of our embedding
plt.scatter(embedding[0], embedding[1], s=100 * d ** 2, c=labels,
            cmap=plt.cm.nipy_spectral)
# Plot the edges
start_idx, end_idx = np.where(non_zero)
# a sequence of (*line0*, *line1*, *line2*), where::
#            linen = (x0, y0), (x1, y1), ... (xm, ym)
segments = [[embedding[:, start], embedding[:, stop]]
            for start, stop in zip(start_idx, end_idx)]
values = np.abs(partial_correlations[non_zero])
lc = LineCollection(segments,
                    zorder=0, cmap=plt.cm.hot_r,
                    norm=plt.Normalize(0, .7 * values.max()))
lc.set_array(values)
lc.set_linewidths(15 * values)
ax.add_collection(lc)
# Add a label to each node. The challenge here is that we want to
# position the labels to avoid overlap with other labels
for index, (name, label, (x, y)) in enumerate(
        zip(names, labels, embedding.T)):
    dx = x - embedding[0]
    dx[index] = 1
    dy = y - embedding[1]
    dy[index] = 1
    this_dx = dx[np.argmin(np.abs(dy))]
    this_dy = dy[np.argmin(np.abs(dx))]
    if this_dx > 0:
        horizontalalignment = 'left'
        x = x + .002
    else:
        horizontalalignment = 'right'
        x = x - .002
    if this_dy > 0:
        verticalalignment = 'bottom'
        y = y + .002
    else:
        verticalalignment = 'top'
        y = y - .002
    plt.text(x, y, name, size=10,
             horizontalalignment=horizontalalignment,
             verticalalignment=verticalalignment,
             bbox=dict(facecolor='w',
                       edgecolor=plt.cm.nipy_spectral(label / float(n_labels)),
                       alpha=.6))
plt.xlim(embedding[0].min() - .15 * embedding[0].ptp(),
         embedding[0].max() + .10 * embedding[0].ptp(),)
plt.ylim(embedding[1].min() - .03 * embedding[1].ptp(),
         embedding[1].max() + .03 * embedding[1].ptp())
plt.show()
作者:IVIVI_PLUS