基于Python——Kmeans聚类算法的实现
1、概述
作者:咖啡苦涩
本篇博文为数据挖掘算法系列的第一篇。现在对于Kmeans算法进行简单的介绍,Kmeans算法是属于无监督的学习的算法,并且是最基本、最简单的一种基于距离的聚类算法。
下面简单说一下Kmeans算法的步骤: 选随机选取K的簇中心(注意这个K是自己选择的) 计算每个数据点离这K个簇中心的距离,然后将这个点划分到距离最小的簇中 重新计算簇中心,即将每个簇的所有数据点相加求均值,将这个均值作为对应簇的新簇中心。 重复2、3步,直到满足了你设置的停止算法迭代的条件 注意:停止算法迭代的条件一般有三个: 没有(或最小数目)对象被重新分配给不同的聚类。 没有(或最小数目)聚类中心再发生变化。 误差平方和局部最小。常用的距离公式有:1、欧式距离; 2、曼哈顿距离;3、切比雪夫距离等等
二、实现下面给出实现代码,在这里我设置的停止条件是第三种,即误差平方和最小
import numpy as np
import random
import matplotlib.pyplot as plt
from calculate_distance_algorithm import euclid_distance
plt.rcParams['font.sans-serif'] = ['SimHei']  # 用来正常显示中文标签
plt.rcParams['axes.unicode_minus'] = False  # 用来正常显示负号
class KMeans:
    def __init__(self, n_cluster, algorithm=euclid_distance, iterators=None):
        self.n_cluster = n_cluster
        self.cluster_centers_ = None
        self.algorithm = euclid_distance
        self.iterations = iterators
        self.loss = None
    def fit(self, data):
        """
            进行k-means算法迭代,划分簇
            :param Y: Y是对应X正确的种类
            :param iterators: 算法迭代次数
            :param data: 数据集(X, Y) X是测试点,
            :param k:最终要划分出簇的个数
            :param calculate_method:计算距离使用的公式 默认为计算两点间的欧式距离,可以通过传递计算距离的方法名来更改计算距离方式
            """
        # 获得随机划分的质心
        clusters = self.random_choose_cluster(data, self.n_cluster)
        clusters_collection = {}
        # 一开始的损失值
        loss_value = 1 << 30
        # 统计迭代次数
        count = 0
        while True:
            # 如果达到了指定的迭代次数后,就不迭代了
            if count == self.iterations and self.iterations != -1:
                break
            count += 1
            # 初始化每个簇集合
            for index, cluster in enumerate(clusters):
                clusters_collection[index] = []
            for pos, x in enumerate(data):
                min = 1 << 30
                min_index = -1
                # 遍历每个数据,计算与k个簇的质心的距离
                for index, cluster in enumerate(clusters):
                    # 计算每个点与对应质心的距离
                    dis = self.algorithm(x, cluster)
                    if dis  loss_value:
                # 重新计算每个簇的质心
                self.calculate_centroid(clusters_collection, clusters)
            elif now_loss_value < loss_value:
                print("算法正在运行,迭代次数:{}".format(count))
                # 重新计算每个簇的质心
                self.calculate_centroid(clusters_collection, clusters)
            elif now_loss_value == loss_value:
                self.cluster_centers_ = clusters
                self.loss = now_loss_value
                return self
            # 更新损失值
            loss_value = now_loss_value
    def predict(self, X):
        """
        预测函数
        :param X: 需要预测的数据点
        :param clusters: 分配好了的簇中心集合
        :return: 返回对应数据点预测对应的簇种类
        """
        result = []
        for x in X:
            min_index = -1
            max_dis = 1 < dis:
                    max_dis = dis
                    min_index = index
            result.append(min_index)
        return np.array(result)
    def random_choose_cluster(self, data, k):
        """
        随机在数据data中选取k个簇
        :param data: 数据集
        :param k: 选取的簇的个数
        :return: 返回包含选取k个簇坐标的列表
        """
        clusters = []
        pos = random.sample(range(len(data)), k)
        for i in pos:
            clusters.append(data[i])
        return np.array(clusters)
    def calculate_centroid(self, collection, clusters):
        """
        计算集合的质心
        计算方法:将对应集合所有数据的x、y加起来,求平均值,将这个平均值点返回
        :param collection: 需要计算质心的集合
        :return: 返回这个集合的质心
        """
        # 重新计算每个簇的质心
        for i in collection.keys():
            if len(collection[i]) > 0:
                result = np.mean(collection[i], axis=0)
                clusters[i] = result
    def loss_function(self, data, clusters):
        """
        衡量K-means算法停止迭代的损失函数
        :param data: 所有簇集合
        :param clusters: 每个簇对应的质心
        :return: 返回损失值
        """
        total = 0
        for i in data:
            for x in data[i]:
                total += self.algorithm(x, clusters[i])
        return total
距离算法公式实现(calculate_distance_algorithm.py):
import numpy as np
def manhattan_distance(x1, x2):
    """
    计算两点间的曼哈顿距离
    :param x1:(x1, y1)
    :param x2:(x2, y2)
    :return:返回两点之间的曼哈顿距离
    """
    result = np.abs(x1[0] - x2[0]) + np.abs(x1[1] - x1[1])
    return result
def chebyshev_distance(x1, x2):
    """
    计算两点间的切比雪夫距离
    :param x1:(x1, y1)
    :param x2:(x2, y2)
    :return:返回两点之间的切比雪夫距离
    """
    return np.max(np.abs(x1 - x2))
def euclid_distance(x1, x2):
    """
    计算两点间的欧式距离
    :param x1:(x1, y1)
    :param x2:(x2, y2)
    :return: 返回两点之间的欧式距离
    """
    return np.sqrt(np.sum((x1 - x2) ** 2))
下面给出使用Kmeans聚类算法对图片进行聚类的实现。
聚类图片对象为: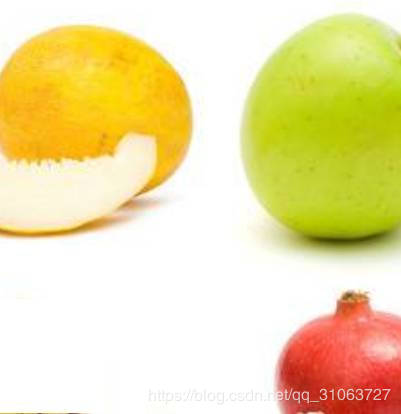
import numpy as np
import matplotlib.pyplot as plt
from sklearn.model_selection import train_test_split
import cv2 as cv
from K_means import KMeans
from calculate_distance_algorithm import manhattan_distance, chebyshev_distance, euclid_distance
def recreate_image(clusters, labels, w, h):
"""
重新创建图像
:param clusters: 聚类中心
:param labels: 预测的种类集合
:param w: 图像的宽
:param h: 图像的高
:return: 返回图像
"""
d = clusters.shape[1]
# 构建图像 w:宽, h:高, d:聚类个数
# print(clusters)
image = np.zeros((w, h, d))
label_idx = 0
for i in range(w):
for j in range(h):
image[i][j] = clusters[labels[label_idx]]
# print(image[i][j])
label_idx += 1
return image
def get_data(data, k):
"""
将对应的三维数组转换成 n*4维的矩阵,前3列是数据,最后一列是该类数据对应的样本标签值k
:param data: 数据
:param k: 标签
:return: 转换好的n*4维数据
"""
# 展开成n*3维
data = data.reshape(-1, 3)
# 生成颜色对应的标签
data_label = np.ones((data.shape[0], 1))
data_label *= k
# 将标签列与数据合并
return np.hstack((data, data_label))
if __name__ == '__main__':
# ----------------------------->读入数据,创建数据集并划分训练集和测试集对图片进行聚类<--------------------------------------#
# 获得图片的宽、高、颜色深度
w, h, d = img.shape
# 展开成n*3维的矩阵,-1代表自适应
img = np.array(img.reshape(-1, 3), dtype=np.float64)
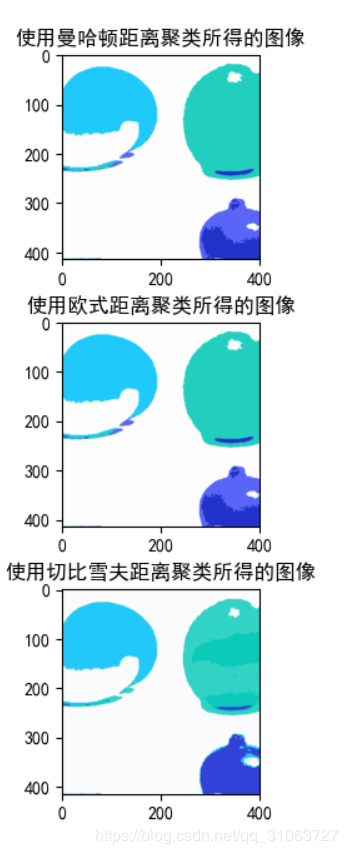
# -----------------------------使用曼哈顿距离进行聚类-----------------------------
plt.figure()
plt.subplot(3, 1, 1)
print("使用曼哈顿距离聚类开始。。。。。。。")
# 建立Kmeans分类
estimator = KMeans(n_cluster=5, algorithm=manhattan_distance) # 默认是使用欧式距离计算
# 使用训练集来聚类,找到每个种类对应的簇中心
estimator.fit(x_train)
# 根据训练好的结果,对整个图像进行聚类
y_predict = estimator.predict(img)
# 将聚类结果显示
image = recreate_image(estimator.cluster_centers_, y_predict, w, h)
plt.title("使用曼哈顿距离聚类所得的图像")
plt.imshow(image)
# -----------------------------使用欧式距离进行聚类-----------------------------
# 建立Kmeans分类
plt.subplot(3, 1, 2)
print("使用欧式距离聚类开始。。。。。。。")
estimator = KMeans(n_cluster=5, algorithm=euclid_distance) # 默认是使用欧式距离计算
# 使用训练集来聚类,找到每个种类对应的簇中心
estimator.fit(x_train)
# 根据训练好的结果,对整个图像进行聚类
y_predict = estimator.predict(img)
# 将聚类结果显示
image = recreate_image(estimator.cluster_centers_, y_predict, w, h)
plt.title("使用欧式距离聚类所得的图像")
plt.imshow(image)
# -----------------------------使用切比雪夫距离进行聚类-----------------------------
# 建立Kmeans分类
plt.subplot(3, 1, 3)
print("使用切比雪夫距离聚类开始。。。。。。。")
estimator = KMeans(n_cluster=5, algorithm=chebyshev_distance) # 默认是使用欧式距离计算
# 使用训练集来聚类,找到每个种类对应的簇中心
estimator.fit(x_train)
# 根据训练好的结果,对整个图像进行聚类
y_predict = estimator.predict(img)
# 将聚类结果显示
image = recreate_image(estimator.cluster_centers_, y_predict, w, h)
plt.title("使用切比雪夫距离聚类所得的图像")
plt.imshow(image)
plt.show()
因为聚类是无监督的学习算法,所以一般来说是不会用来分类的。评价一个聚类模型的好坏,可以根据模型的轮廓系数来判定,至于这个轮廓系数是啥东西,大家可以参考sklearn关于Kmeans的说明,或者百度,Google。
作者:咖啡苦涩