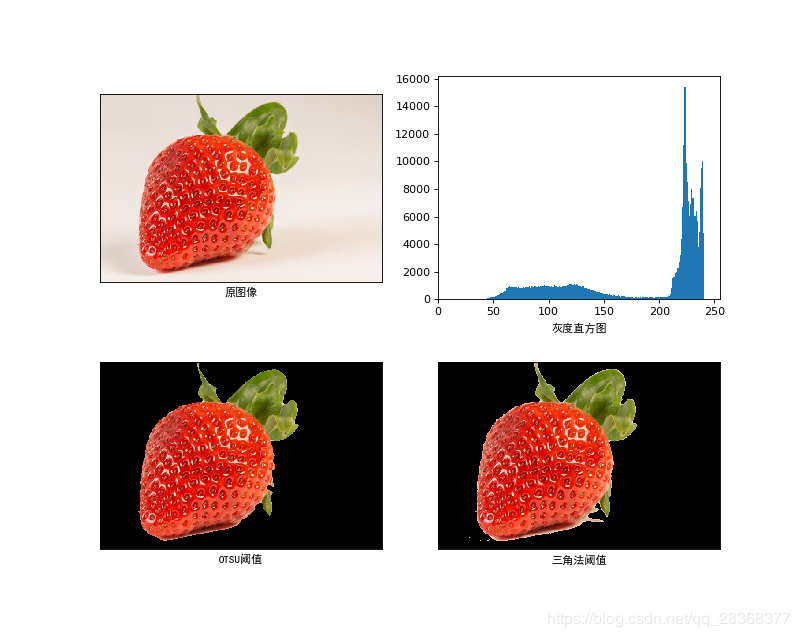
基于OTSU与三角阈值的方法分割彩色图像(opencv-python)
import cv2
import matplotlib.pyplot as plt
img = cv2.imread("macro-photography-of-strawberry-934066.jpg")
gray_img = cv2.cvtColor(img,cv2.COLOR_BGR2GRAY)
# otsu阈值
(t,thresh) = cv2.threshold(gray_img,0,255,cv2.THRESH_TOZERO_INV+cv2.THRESH_OTSU)
# 三角法阈值:由直方图凹凸性确定的阈值
(t,thresh1) = cv2.threshold(gray_img,0,255,cv2.THRESH_TOZERO_INV+cv2.THRESH_TRIANGLE)
# 形态学操作
kernel = cv2.getStructuringElement(cv2.MORPH_ELLIPSE,(10,10))
kernel1 = cv2.getStructuringElement(cv2.MORPH_ELLIPSE,(7,7))
thresh = cv2.morphologyEx(thresh,cv2.MORPH_CLOSE,kernel)
thresh1 = cv2.morphologyEx(thresh1,cv2.MORPH_CLOSE,kernel1)
# 颜色空间转换:BGR转RGB
img1 = cv2.cvtColor(img,cv2.COLOR_BGR2RGB)
result = cv2.cvtColor(cv2.bitwise_and(img, img,mask=thresh),cv2.COLOR_BGR2RGB)
result1 = cv2.cvtColor(cv2.bitwise_and(img, img,mask=thresh1),cv2.COLOR_BGR2RGB)
# 图像显示
plt.figure(figsize=(10,8),dpi=80)
plt.subplot(221)
plt.imshow(img1)
plt.xlabel("原图像",fontproperties='SimHei')
plt.yticks([])
plt.xticks([])
plt.subplot(222)
plt.hist(gray_img.flat,bins=255,range=(0,256))
plt.xlabel("灰度直方图",fontproperties='SimHei')
plt.xlim(0,255)
plt.subplot(223)
plt.imshow(result)
plt.xlabel("OTSU阈值",fontproperties='SimHei')
plt.yticks([])
plt.xticks([])
plt.subplot(224)
plt.imshow(result1)
plt.xlabel("三角法阈值",fontproperties='SimHei')
plt.yticks([])
plt.xticks([])
plt.show()
输出结果:
作者:陨星落云