visual prediction中的几个metrics
这里记录一下在Visual Prediction中用到的几种metrics:
The structural similarity (SSIM)
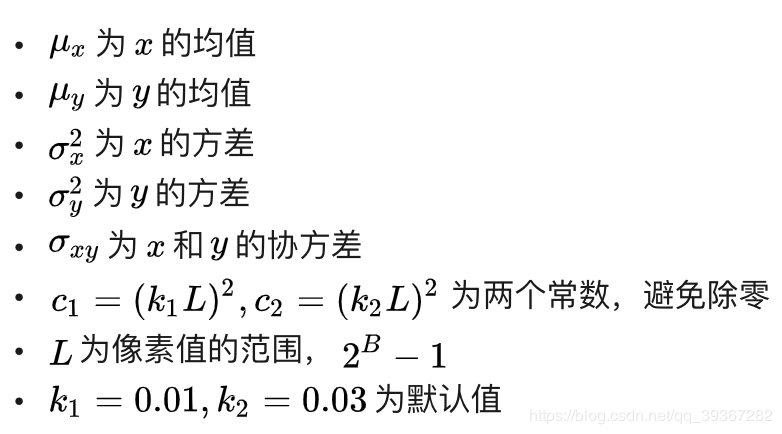
其中

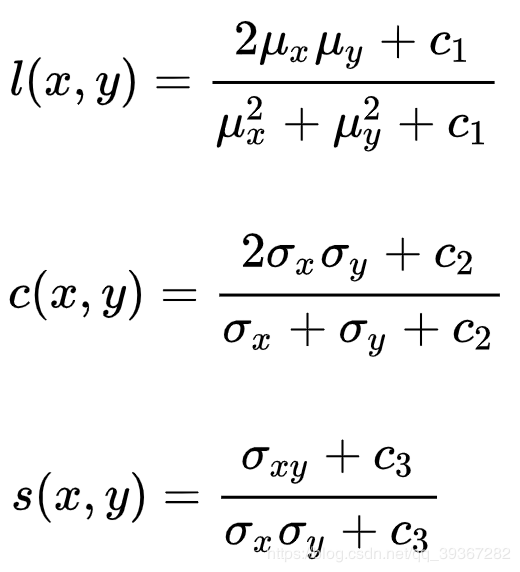
SSIM的公式基于样本x和y之间的三个比较衡量:亮度 (luminance)、对比度 (contrast) 和结构 (structure)。

所以SSIM也可以写成这三个部分的组合

其中alpha,beta, gama和为1。
  def cal_ssim(im1,im2):
      assert len(im1.shape) == 2 and len(im2.shape) == 2
      assert im1.shape == im2.shape
      mu1 = im1.mean()
      mu2 = im2.mean()
      sigma1 = np.sqrt(((im1 - mu1) ** 2).mean())
      sigma2 = np.sqrt(((im2 - mu2) ** 2).mean())
      sigma12 = ((im1 - mu1) * (im2 - mu2)).mean()
      k1, k2, L = 0.01, 0.03, 255
      C1 = (k1*L) ** 2
      C2 = (k2*L) ** 2
      C3 = C2/2
      l12 = (2*mu1*mu2 + C1)/(mu1 ** 2 + mu2 ** 2 + C1)
      c12 = (2*sigma1*sigma2 + C2)/(sigma1 ** 2 + sigma2 ** 2 + C2)
      s12 = (sigma12 + C3)/(sigma1*sigma2 + C3)
      ssim = l12 * c12 * s12
      return ssim
The peak signal-to-noise ratio (PSNR)
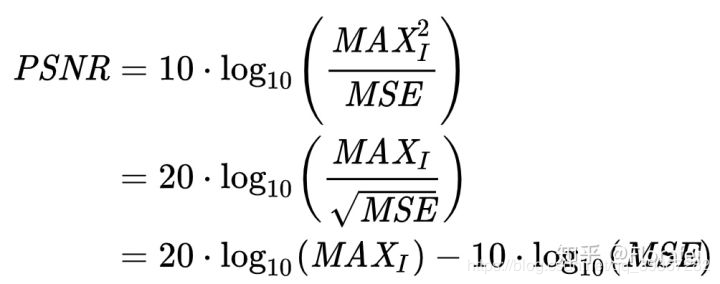
峰值信噪比PSNR=峰值信号的能量 / 噪声的平均能量
噪声的平均能量 = MSE

MSE越小,则PSNR越大,PSNR越大,代表图像质量越好。
一般来说,PSNR高于40dB说明图像质量极好(即非常接近原始图像),在30—40dB通常表示图像质量是好的(即失真可以察觉但可以接受),在20—30dB说明图像质量差;PSNR低于20dB图像不可接受
PSNR计算,这里针对uint8 数据,MAX1为255 def cal_psnr(im1, im2):
mse = (np.abs(im1 - im2) ** 2).mean()
psnr = 10 * np.log10(255 * 255 / mse)
return psnr
The learned perceptual image patch similarity (LPIPS)
也称为“perceptual loss“,用于评估两个图像之间的差别,越高表示越不同,越低表示越相似。
代码有Pytorch版本和TF版本(将Pytorch中的模型迁移到TF)
指标来源
The Unreasonable Effectiveness of Deep Features as a Perceptual
Metric
这篇论文提出深层网络激活作为感知的相似性指标效果很好,在SqueezeNet,AlexNet和VGG结构下提供了相似的分数。
作者:FloraFei