Java在PowerPoint幻灯片中创建散点图的方法
代码编译环境:
创建散点图
完整代码
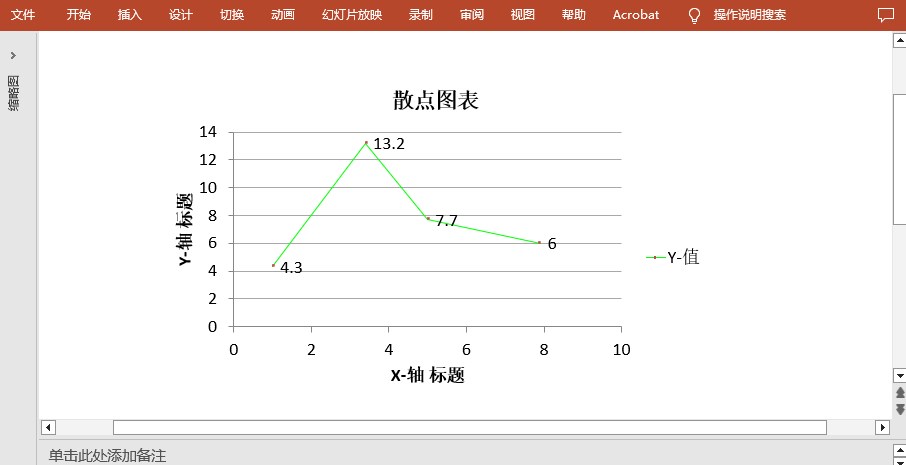
效果图
散点图是通过两组数据构成多个坐标点,考察坐标点的分布,判断两变量之间是否存在某种关联或总结坐标点的分布模式。散点图将序列显示为一组点,值由点在图表中的位置表示,类别由图表中的不同标记表示,通常用于比较跨类别的聚合数据。本文将为您介如何通过Java代码在PowerPoint幻灯片中创建散点图。以下是我整理的具体方法及思路,并附上Java代码供大家参考。
代码编译环境:IntelliJ IDEA 2018(jdk 1.8.0)
Presentation Jar包:Free Spire.Presentation for Java 5.1.0
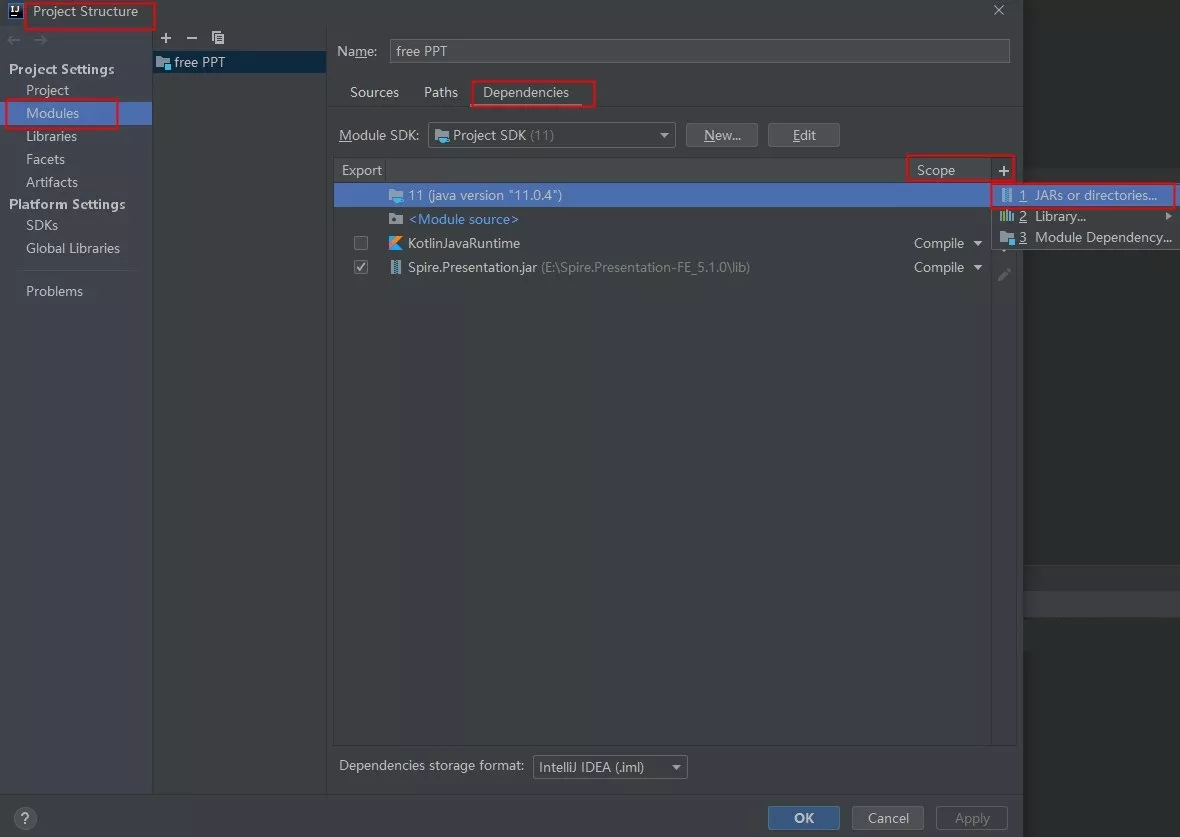
引入jar包
导入方法1:
手动引入。将Free Spire. Presentation for Java下载到本地,解压,找到lib文件夹下的Spire. Presentation.jar文件。在IDEA中打开如下界面,将本地路径中的jar文件引入Java程序:

导入方法2:如果您想通过 Maven安装,则可以在 pom.xml 文件中添加以下代码导入 JAR 文件。
<repositories>
    <repository>
        <id>com.e-iceblue</id>
        <name>e-iceblue</name>
        <url>https://repo.e-iceblue.cn/repository/maven-public/</url>
    </repository>
</repositories>
<dependencies>
    <dependency>
        <groupId>e-iceblue</groupId>
        <artifactId>spire.presentation.free</artifactId>
        <version>5.1.0</version>
    </dependency>
</dependencies>
创建散点图
下面是创建散点图的具体方法和步骤:
创建 Presentation 类的实例。
使用 ShapeCollection.appendChart() 方法将散点图附加到特定的幻灯片。
通过 ChartData.get().setValue() 方法设置图表数据。
使用 IChart 接口提供的方法设置图表标题、坐标轴标题、系列标签等。
设置网格线样式和数据点线样式。
使用 Presentation.saveToFile() 方法将文档保存到指定路径。
完整代码Java
import com.spire.presentation.FileFormat;
import com.spire.presentation.Presentation;
import com.spire.presentation.SlideSizeType;
import com.spire.presentation.TextLineStyle;
import com.spire.presentation.charts.ChartType;
import com.spire.presentation.charts.IChart;
import com.spire.presentation.charts.entity.ChartDataLabel;
import com.spire.presentation.drawing.FillFormatType;
import java.awt.*;
import java.awt.geom.Rectangle2D;
public class ScatterChart {
    public static void main(String[] args) throws Exception{
        //创建Presentation类的实例
        Presentation presentation = new Presentation();
        presentation.getSlideSize().setType(SlideSizeType.SCREEN_16_X_9);
        //添加散点图表到第一张幻灯片
        IChart chart = presentation.getSlides().get(0).getShapes().appendChart(ChartType.SCATTER_MARKERS,new Rectangle2D.Float(180, 80, 550, 320),false);
        //设置图表标题
        chart.getChartTitle().getTextProperties().setText("散点图表");
        chart.getChartTitle().getTextProperties().isCentered(true);
        chart.getChartTitle().setHeight(20f);
        chart.hasTitle(true);
        //设置图表数据源
        Double[] xData = new Double[] { 1.0, 3.4, 5.0, 7.9 };
        Double[] yData = new Double[] { 4.3, 13.2, 7.7, 6.0 };
        chart.getChartData().get(0,0).setText("X-值");
        chart.getChartData().get(0,1).setText("Y-值");
        for (int i = 0; i < xData.length; i++) {
            chart.getChartData().get(i+1,0).setValue(xData[i]);
            chart.getChartData().get(i+1,1).setValue(yData[i]);
        }
        //设置系列标签
        chart.getSeries().setSeriesLabel(chart.getChartData().get("B1","B1"));
        //设置X和Y轴值
        chart.getSeries().get(0).setXValues(chart.getChartData().get("A2","A5"));
        chart.getSeries().get(0).setYValues(chart.getChartData().get("B2","B5"));
        //添加数据标签
        for (int i = 0; i < 4; i++)
        {
            ChartDataLabel dataLabel = chart.getSeries().get(0).getDataLabels().add();
            dataLabel.setLabelValueVisible(true);
        }
        //设置主轴标题和次轴标题
        chart.getPrimaryValueAxis().hasTitle(true);
        chart.getPrimaryValueAxis().getTitle().getTextProperties().setText("X-轴 标题");
        chart.getSecondaryValueAxis().hasTitle(true);
        chart.getSecondaryValueAxis().getTitle().getTextProperties().setText("Y-轴 标题");
        //设置网格线
        chart.getSecondaryValueAxis().getMajorGridTextLines().setFillType(FillFormatType.SOLID);
        chart.getSecondaryValueAxis().getMajorGridTextLines().setStyle(TextLineStyle.THIN_THIN);
        chart.getSecondaryValueAxis().getMajorGridTextLines().getSolidFillColor().setColor(Color.GRAY);
        chart.getPrimaryValueAxis().getMajorGridTextLines().setFillType(FillFormatType.NONE);
        //设置数据点线
        chart.getSeries().get(0).getLine().setFillType(FillFormatType.SOLID);
        chart.getSeries().get(0).getLine().setWidth(0.1f);
        chart.getSeries().get(0).getLine().getSolidFillColor().setColor(Color.GREEN);
        //保存文档
        presentation.saveToFile("ScatterChart.pptx", FileFormat.PPTX_2013);
        presentation.dispose();
    }
}
效果图

到此这篇关于Java如何在PowerPoint幻灯片中创建散点图的文章就介绍到这了,更多相关Java PowerPoint幻灯片散点图内容请搜索软件开发网以前的文章或继续浏览下面的相关文章希望大家以后多多支持软件开发网!