aistdio paddlepaddle(飞浆) python 学习 Day3-《青春有你2》选手数据分析
!!!作业说明!!!
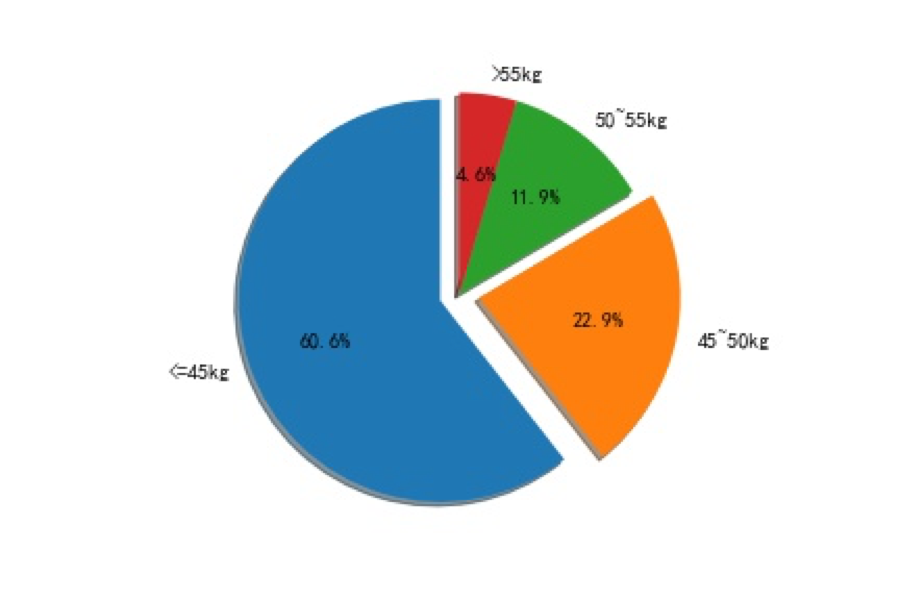
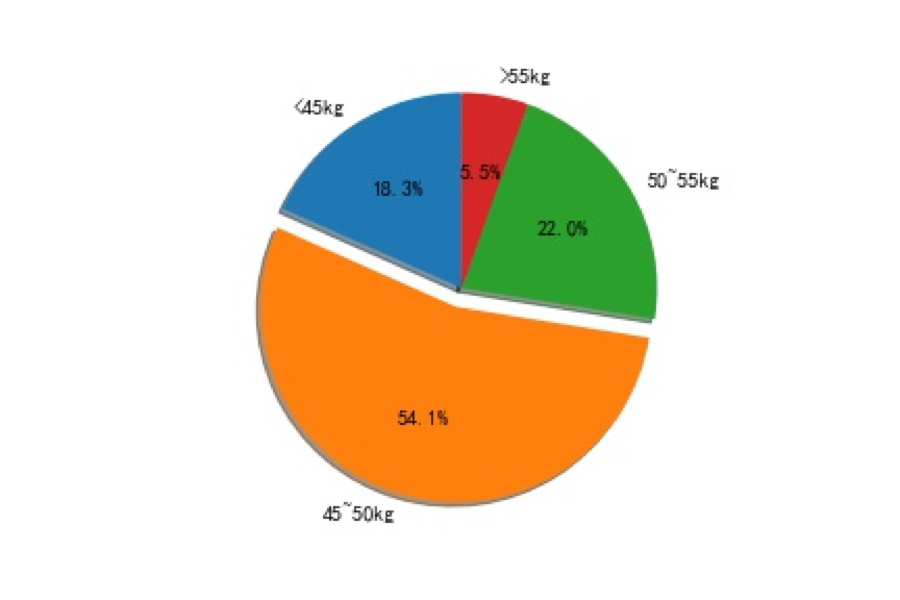
请在下方提示位置,补充代码,对《青春有你2》对选手体重分布进行可视化,绘制饼状图,如下图所示:
不要求跟下图样式一模一样
 任务描述:
任务描述:
作者:livingbody
任务描述:
基于第二天实践使用Python来爬去百度百科中《青春有你2》所有参赛选手的信息,进行数据可视化分析。
# 如果需要进行持久化安装, 需要使用持久化路径, 如下方代码示例:
#!mkdir /home/aistudio/external-libraries
#!pip install matplotlib -t /home/aistudio/external-libraries
# 同时添加如下代码, 这样每次环境(kernel)启动的时候只要运行下方代码即可:
# Also add the following code, so that every time the environment (kernel) starts, just run the following code:
import sys
ys
sys.path.append('/home/aistudio/external-libraries')
# 下载中文字体
!wget https://mydueros.cdn.bcebos.com/font/simhei.ttf
# 将字体文件复制到matplotlib字体路径
!cp simhei.ttf /opt/conda/envs/python35-paddle120-env/lib/python3.7/site-packages/matplotlib/mpl-data/fonts/ttf/
# 一般只需要将字体文件复制到系统字体目录下即可,但是在aistudio上该路径没有写权限,所以此方法不能用
# !cp simhei.ttf /usr/share/fonts/
# 创建系统字体文件路径
!mkdir .fonts
# 复制文件到该路径
!cp simhei.ttf .fonts/
!rm -rf .cache/matplotlib
--2020-04-24 18:15:39--  https://mydueros.cdn.bcebos.com/font/simhei.ttf
Resolving mydueros.cdn.bcebos.com (mydueros.cdn.bcebos.com)... 182.61.128.198
Connecting to mydueros.cdn.bcebos.com (mydueros.cdn.bcebos.com)|182.61.128.198|:443... connected.
HTTP request sent, awaiting response... 200 OK
Length: 9753388 (9.3M) [application/octet-stream]
Saving to: ‘simhei.ttf.4’
simhei.ttf.4        100%[===================>]   9.30M  50.8MB/s    in 0.2s
2020-04-24 18:15:40 (50.8 MB/s) - ‘simhei.ttf.4’ saved [9753388/9753388]
mkdir: cannot create directory ‘.fonts’: File exists
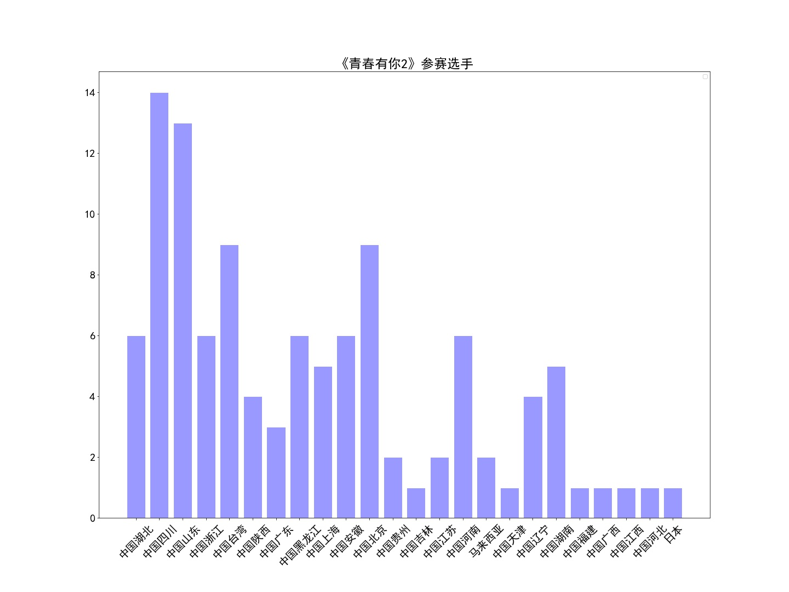
绘制选手区域分布柱状图
import matplotlib.pyplot as plt
import numpy as np
import json
import matplotlib.font_manager as font_manager
#显示matplotlib生成的图形
%matplotlib inline
with open('data/data31557/20200422.json', 'r', encoding='UTF-8') as file:
         json_array = json.loads(file.read())
#绘制小姐姐区域分布柱状图,x轴为地区,y轴为该区域的小姐姐数量
zones = []
for star in json_array:
    zone = star['zone']
    zones.append(zone)
print(len(zones))
print(zones)
zone_list = []
count_list = []
for zone in zones:
    if zone not in zone_list:
        count = zones.count(zone)
        zone_list.append(zone)
        count_list.append(count)
print(zone_list)
print(count_list)
# 设置显示中文
plt.rcParams['font.sans-serif'] = ['SimHei'] # 指定默认字体
plt.figure(figsize=(20,15))
plt.bar(range(len(count_list)), count_list,color='r',tick_label=zone_list,facecolor='#9999ff',edgecolor='white')
# 这里是调节横坐标的倾斜度,rotation是度数,以及设置刻度字体大小
plt.xticks(rotation=45,fontsize=20)
plt.yticks(fontsize=20)
plt.legend()
plt.title('''《青春有你2》参赛选手''',fontsize = 24)
plt.savefig('/home/aistudio/work/result/bar_result.jpg')
# plt.savefig('./work/result/bar_result.jpg')
plt.show()
No handles with labels found to put in legend.
109
['中国湖北', '中国四川', '中国山东', '中国浙江', '中国山东', '中国台湾', '中国陕西', '中国广东', '中国黑龙江', '中国上海', '中国四川', '中国山东', '中国安徽', '中国安徽', '中国安徽', '中国北京', '中国贵州', '中国吉林', '中国四川', '中国四川', '中国江苏', '中国山东', '中国山东', '中国山东', '中国山东', '中国江苏', '中国四川', '中国山东', '中国山东', '中国广东', '中国浙江', '中国河南', '中国安徽', '中国河南', '中国北京', '中国北京', '马来西亚', '中国湖北', '中国四川', '中国天津', '中国黑龙江', '中国四川', '中国陕西', '中国辽宁', '中国湖南', '中国上海', '中国贵州', '中国山东', '中国湖北', '中国黑龙江', '中国黑龙江', '中国上海', '中国浙江', '中国湖南', '中国台湾', '中国台湾', '中国台湾', '中国台湾', '中国山东', '中国北京', '中国北京', '中国浙江', '中国河南', '中国河南', '中国福建', '中国河南', '中国北京', '中国山东', '中国四川', '中国安徽', '中国河南', '中国四川', '中国湖北', '中国四川', '中国陕西', '中国湖南', '中国四川', '中国台湾', '中国湖北', '中国广西', '中国江西', '中国湖南', '中国湖北', '中国北京', '中国陕西', '中国上海', '中国四川', '中国山东', '中国辽宁', '中国辽宁', '中国台湾', '中国浙江', '中国北京', '中国黑龙江', '中国北京', '中国安徽', '中国河北', '马来西亚', '中国四川', '中国湖南', '中国台湾', '中国广东', '中国上海', '中国四川', '日本', '中国辽宁', '中国黑龙江', '中国浙江', '中国台湾']
['中国湖北', '中国四川', '中国山东', '中国浙江', '中国台湾', '中国陕西', '中国广东', '中国黑龙江', '中国上海', '中国安徽', '中国北京', '中国贵州', '中国吉林', '中国江苏', '中国河南', '马来西亚', '中国天津', '中国辽宁', '中国湖南', '中国福建', '中国广西', '中国江西', '中国河北', '日本']
[6, 14, 13, 6, 9, 4, 3, 6, 5, 6, 9, 2, 1, 2, 6, 2, 1, 4, 5, 1, 1, 1, 1, 1]
[外链图片转存失败,源站可能有防盗链机制,建议将图片保存下来直接上传(img-gai8Yf2z-1587724818763)(output_6_2.png)]
import matplotlib.pyplot as plt
import numpy as np
import json
import matplotlib.font_manager as font_manager
import pandas as pd
#显示matplotlib生成的图形
%matplotlib inline
df = pd.read_json('data/data31557/20200422.json')
#print(df)
grouped=df['name'].groupby(df['zone'])
s = grouped.count()
zone_list = s.index
count_list = s.values
# 设置显示中文
plt.rcParams['font.sans-serif'] = ['SimHei'] # 指定默认字体
plt.figure(figsize=(20,15))
plt.bar(range(len(count_list)), count_list,color='r',tick_label=zone_list,facecolor='#9999ff',edgecolor='white')
# 这里是调节横坐标的倾斜度,rotation是度数,以及设置刻度字体大小
plt.xticks(rotation=45,fontsize=20)
plt.yticks(fontsize=20)
plt.legend()
plt.title('''《青春有你2》参赛选手''',fontsize = 24)
plt.savefig('/home/aistudio/work/result/bar_result02.jpg')
plt.show()
No handles with labels found to put in legend.
[外链图片转存失败,源站可能有防盗链机制,建议将图片保存下来直接上传(img-uxyZtN1g-1587724818766)(output_7_1.png)]
请在下面完成作业,对选手体重分布进行可视化,绘制饼状图import matplotlib.pyplot as plt
import numpy as np
import json
import matplotlib.font_manager as font_manager
#显示matplotlib生成的图形
%matplotlib inline
with open('data/data31557/20200422.json', 'r', encoding='UTF-8') as file:
json_array = json.loads(file.read())
#绘制小姐姐区域分布柱状图,x轴为地区,y轴为该区域的小姐姐数量
weight_list= []
for star in json_array:
weight = star['weight'].strip('kg')
weight_list.append(weight)
# print(len(weight_list))
# print(weight_list)
weight_label = ['55kg']
count_list = [0,0,0,0]
for weight in weight_list:
weight=float(weight)
if weight 45 and weight 50 and weight 55:
count_list[3]=count_list[3]+1
continue
print(weight_label)
print(count_list)
# 设置显示中文
plt.rcParams['font.sans-serif'] = ['SimHei'] # 指定默认字体
plt.figure(figsize=(20,15))
# plt.pie(x=count_list ,labels=weight_label,autopct='%1.1f%%',shadow=False,startangle=150)
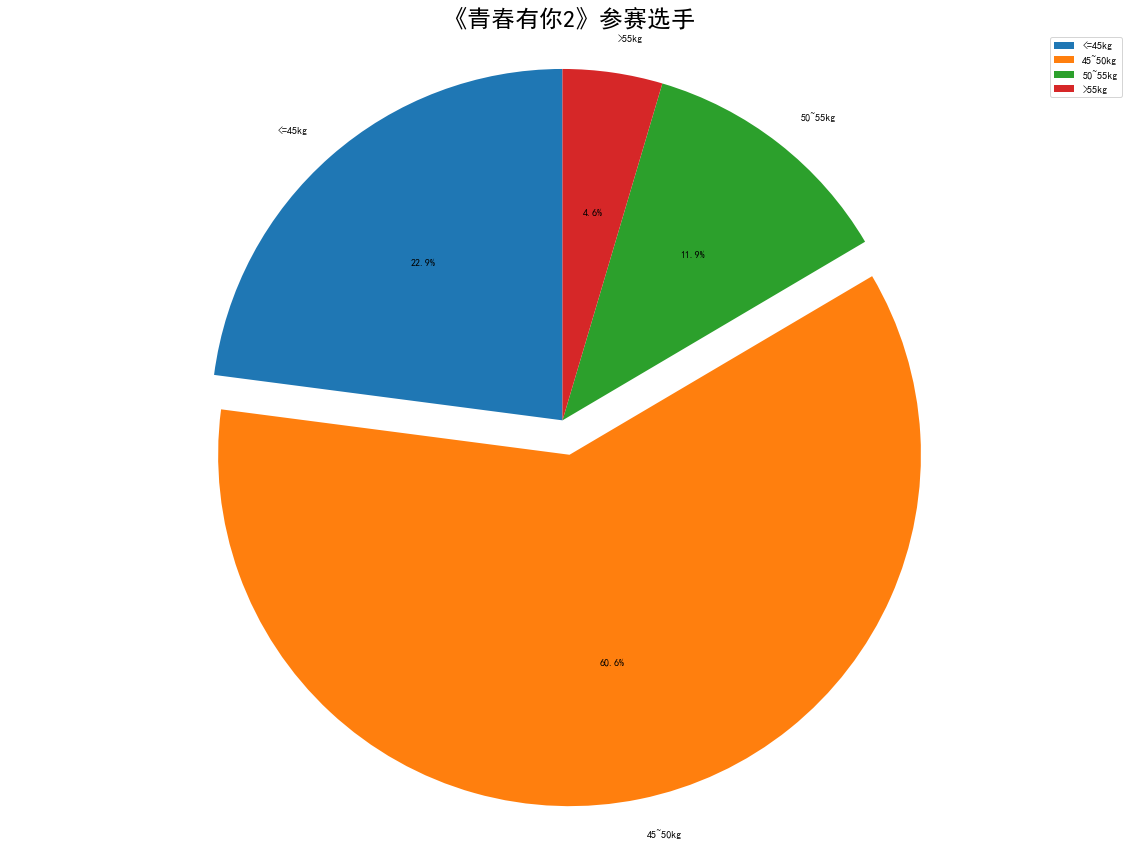
explode = (0, 0.1, 0, 0)
plt.pie(x=count_list ,explode=explode, labels=weight_label,autopct='%1.1f%%', shadow=False, startangle=90)
plt.axis('equal')
plt.legend()
plt.title('''《青春有你2》参赛选手''',fontsize = 24)
plt.savefig('/home/aistudio/work/result/pie_result.jpg')
plt.show()
['55kg']
[25, 66, 13, 5]
作者:livingbody