南丁格尔玫瑰图实现-python+matplotlib绘制极坐标以及一些基础的知识
老师布置的python作业,文字显示要与其倾斜角度一样,代码如下
import numpy as np
import math
import matplotlib.pyplot as plt
fig = plt.figure(figsize=(10,6))#形成一个1000x600的一个白色窗口大小(玫瑰图的显示窗口)
ax = plt.subplot(111, polar=True)#順肘針 projection= 'polar'和polar=True等价
ax.set_theta_direction(-1)#极坐标正方向为顺时针
ax.set_theta_zero_location( 'N' )#极坐标0度的方向设置为正北方向
r = np.arange(100, 800, 20)#从100开始,步长20到800结束
theta = np.linspace(0, np.pi*2, len(r), endpoint=False)#会制柱状圏(从0开始到2Π,形成35个数字)
ax.bar(theta, r,  #每个条的开始位置(度数),每个条对应的高度(因为r从100开始,所以圆心没有东西)
      width=0.18, #每个条的宽度
      color=np.random.random( (len(r),3)),#顔色  随机形成35行3列浮点数
      align='edge', # 从指定角度的径向幵始(0度)如果是center,不能和0度对齐
      bottom=100) #近高园心,没置偏高距高(从底部100开始)
      #在圜心位置湿示文本
ax.text(np.pi*3/2-0.2, 90,'Origin',fontsize=14)#毎个柱的頂部星示文本表示大小
for angle, height in zip(theta, r):
     if math.degrees(angle)>=180:
          ax.text(angle+0.03, height+105, str(height),fontsize=height/80,rotation=-(math.degrees(angle)+90))#不星示坐 柝紬和网格銭
     else:
          ax.text(angle+0.03, height+105, str(height),fontsize=height/80,rotation=-(math.degrees(angle)+270))#旋转默认是逆时针
plt.axis('off')#緊湊布局,縮小外辺距(不显示极坐标的网格线)
plt.tight_layout()
plt.savefig( 'polarBar.png',dpi=480)
plt.show()
上面涉及到的一些知识点总结:
Matplotlib的介绍
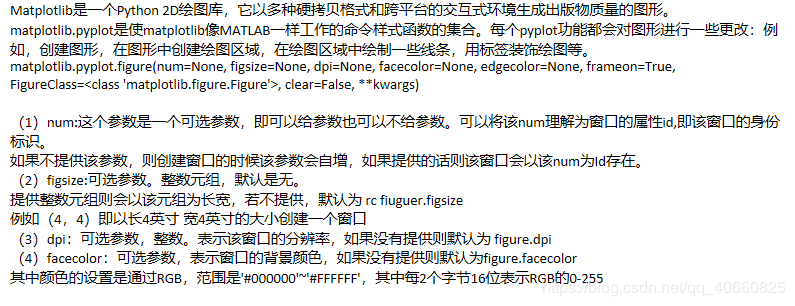
matplotlib.pyplot.figure
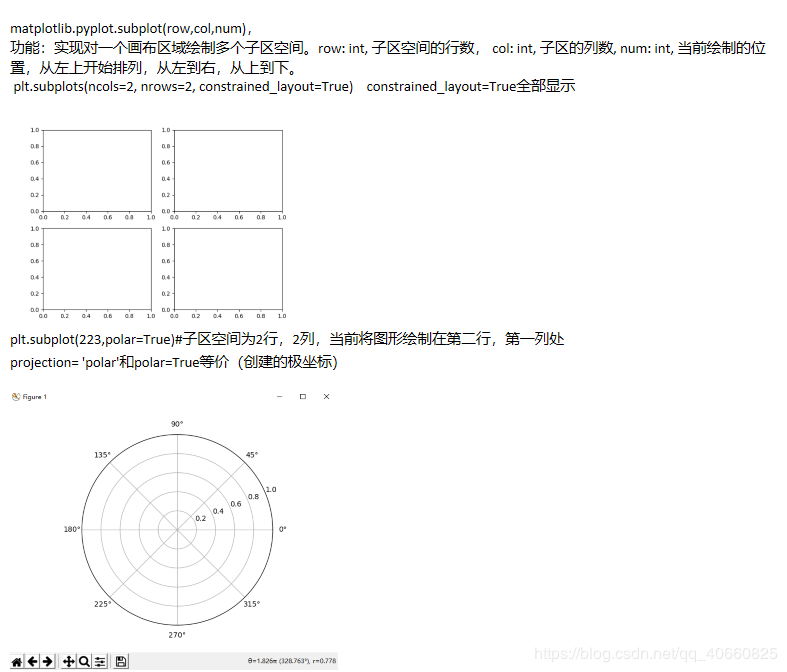
matplotlib.pyplot.subplot
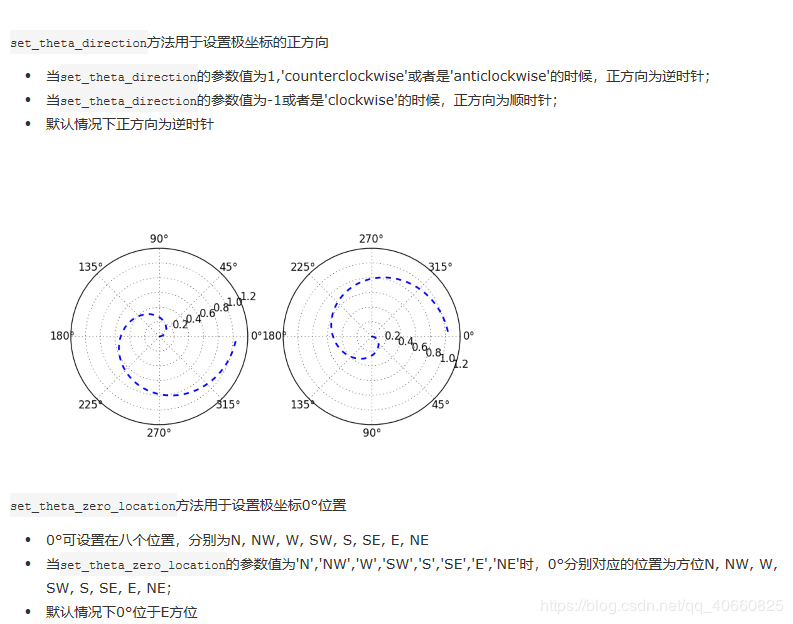
set_theta_direction
角度换弧度,弧度换角度

matplotlib.pyplot.text文本显示
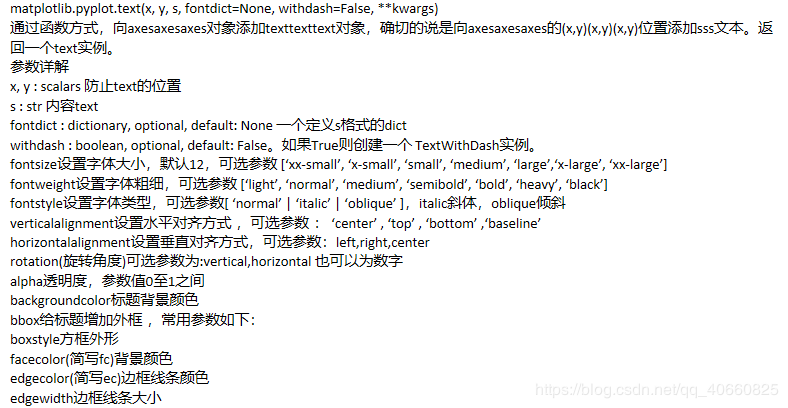
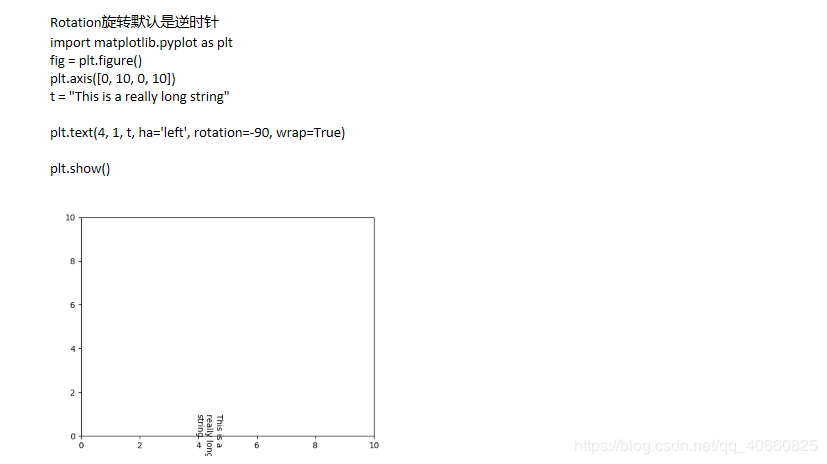
rotation旋转

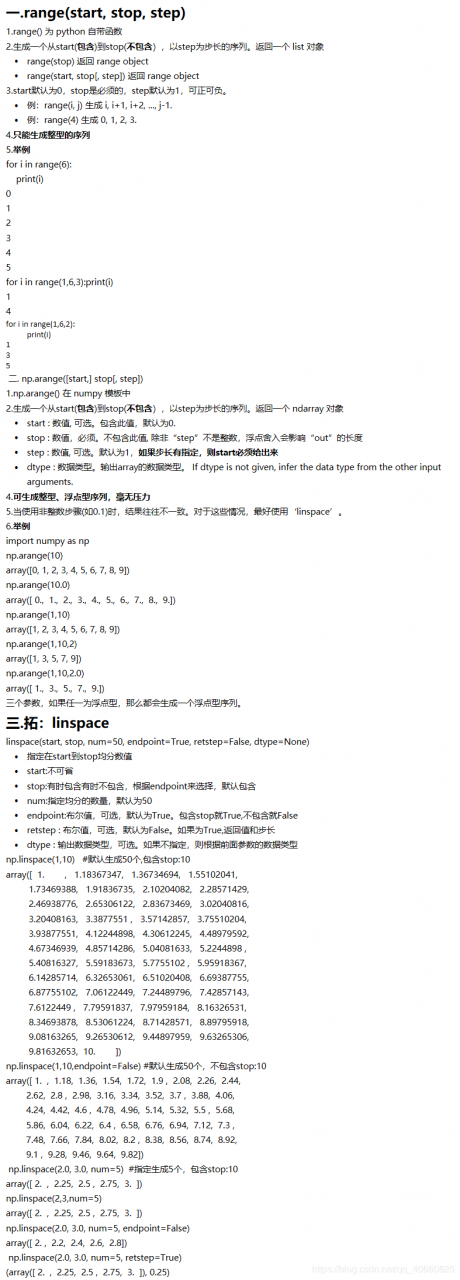
**np.range()
np.arange()
np.linspace()**用法
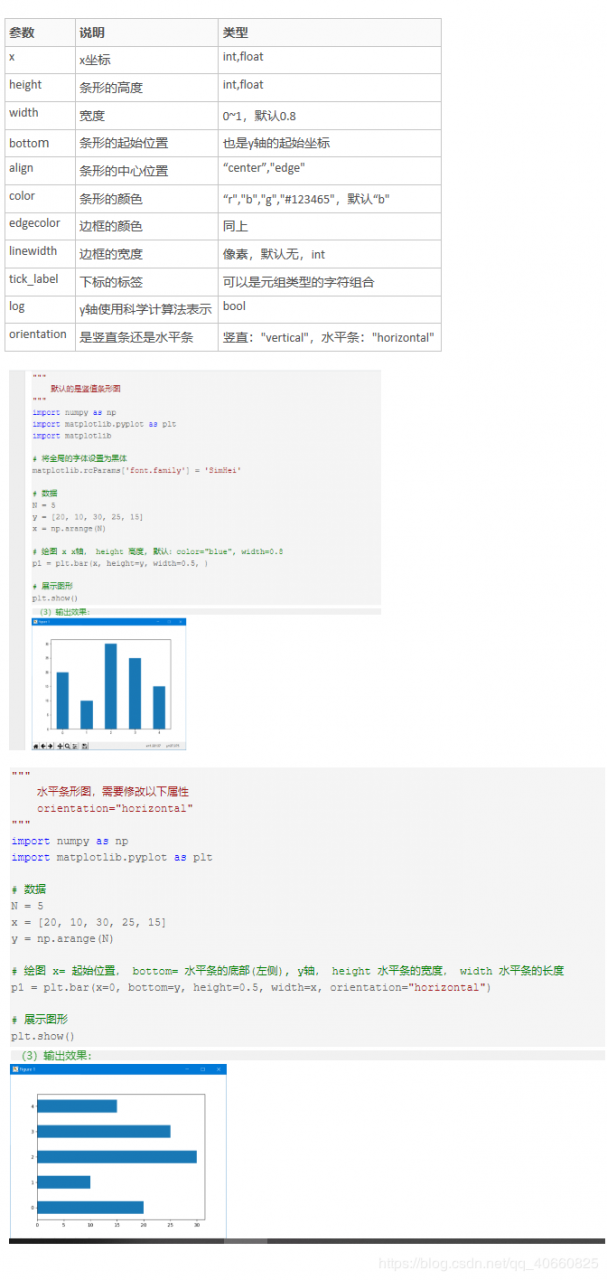
plt.bar()
作者:要奋斗呀