【图解例说机器学习】模型选择:偏差与方差 (Bias vs. Variance)
机器学习的过程大致分为三步:1)模型假设,比如我们假设模型是线性回归,还是多项式回归,以及其阶数的选择;2)误差函数定义,比如我们假设误差函数是均方误差,还是交叉熵;3)参数求解,比如使用正规方程,还是梯度下降等。
这篇文章主要讨论模型的选择问题,下面以多项式回归为例进行说明
一个例子:多项式回归中的阶数选择在前面的文章【图解例说机器学习】线性回归中,我们定义了广义的线性回归模型,其表达式为:
y^=ω0+∑j=1Mωjϕj(x)=ω0+wTϕ(x)(1)
\hat y=\omega_0+\sum\limits_{j=1}^{M}\omega_j\phi_j(\mathrm x)=\omega_0+\mathrm w^{\mathrm T}\phi(\mathrm x)\tag{1}
y^=ω0+j=1∑Mωjϕj(x)=ω0+wTϕ(x)(1)
当D=1,ϕj(x)=xjD=1,\phi_j(\mathrm x)=x^jD=1,ϕj(x)=xj时,公式(1)可以表示为:
y^=ω0+ω1x+ω2x2+⋯+ωMxM(2)
\hat y=\omega_0+\omega_1x+\omega_2x^2+\cdots+\omega_Mx^M\tag{2}
y^=ω0+ω1x+ω2x2+⋯+ωMxM(2)
此时,线性回归就变成了MMM阶多项式回归。
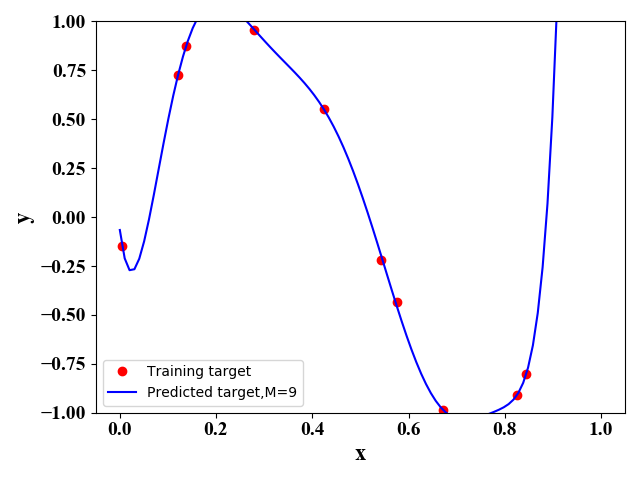
当MMM及误差函数给定时,我们就可以通过梯度下降法求解得到w\mathrm ww。但是,MMM的选择对预测的结果影响较大。从公式可以看出MMM越大,模型越复杂,其函数表达式集合包含了MMM取值较小的情况。从这种角度来看,MMM取值越大越好。但是,一般来说训练数据较少,当MMM取值较大时,复杂的模型会过度学习训练数据间的关系,导致其泛化能力较差。
这里我们通过一个实例来形象化MMM对算法的影响。这里我们假设实际的函数表达式为
y=sin(2πx)+ϵ(3)
y=\sin(2\pi x)+\epsilon\tag{3}
y=sin(2πx)+ϵ(3)
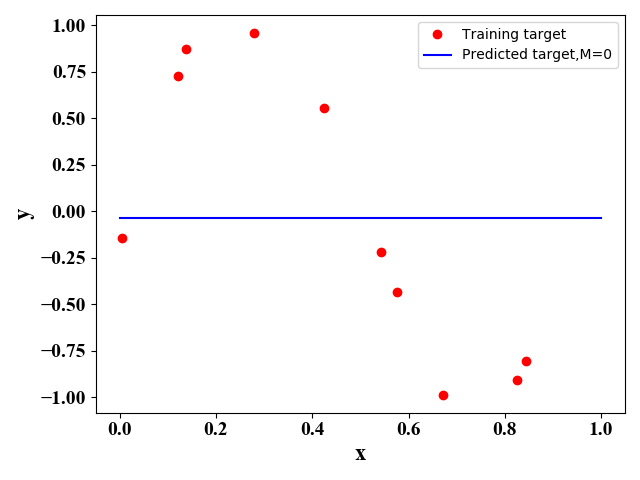
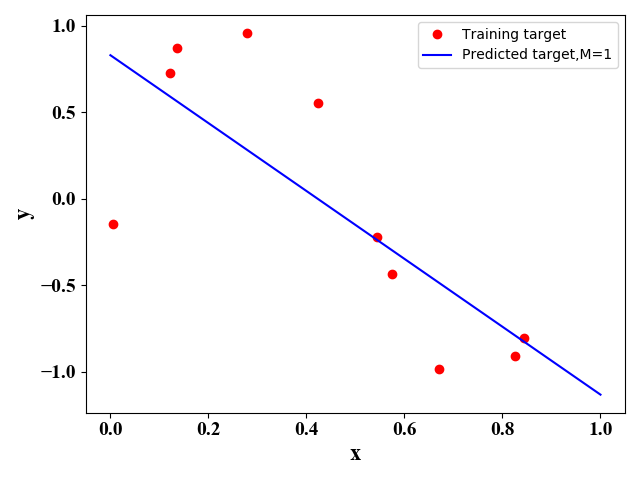
其中,ϵ\epsilonϵ是一个高斯误差值。通过公式(3)我们产生10个样例点(xi,yi)(x_i,y_i)(xi,yi)。在给定不同MMM值时,我们使用正规方程法或梯度下降法可以得到最佳的函数表达式,如下图所示:
 图1 图1 |
 图2 图2 |
 图3 图3 |
 图4 图4 |
图1-图4的python源代码
# -*- coding: utf-8 -*-
# @Time : 2020/4/16 23:40
# @Author : tengweitw
import numpy as np
import matplotlib.pyplot as plt
from matplotlib.colors import ListedColormap
from sklearn import datasets
# Set the format of labels
def LabelFormat(plt):
    ax = plt.gca()
    plt.tick_params(labelsize=14)
    labels = ax.get_xticklabels() + ax.get_yticklabels()
    [label.set_fontname('Times New Roman') for label in labels]
    font = {'family': 'Times New Roman',
            'weight': 'normal',
            'size': 16,
            }
    return font
def Polynomial_regression_normal_equation(train_data, train_target, test_data, test_target):
    # the 1st column is 1 i.e., x_0=1
    X = np.ones([np.size(train_data, 0), 1])
    X_test = np.ones([np.size(test_data, 0), 1])
    # Here to change M !!!!!!!
    M = 2
    for i in range(1, M + 1):
        temp = train_data ** i
        temp_test = test_data ** i
        X = np.concatenate((X, temp), axis=1)
        X_test = np.concatenate((X_test, temp_test), axis=1)
    # X is a 10*M-dim matrix
    # Normal equation
    w_bar = np.matmul(np.linalg.pinv(np.matmul(X.T, X)), np.matmul(X.T, train_target))
    # Training Error
    y_predict_train = np.matmul(X, w_bar)
    E_train = np.linalg.norm(y_predict_train - train_target) / len(y_predict_train)
    # Predicting
    y_predict_test = np.matmul(X_test, w_bar)
    # Prediction Error
    E_test = np.linalg.norm(y_predict_test - test_target) / len(y_predict_test)
    return y_predict_test, E_train, E_test
if __name__ == '__main__':
    # keep the same random training data
    seed_num = 100
    np.random.seed(seed_num)
    # 10 training data
    train_data = np.random.uniform(0, 1, (10, 1))
    train_data = np.sort(train_data, axis=0)
    np.random.seed(seed_num)
    train_target = np.sin(2 * np.pi * train_data) + 0.1 * np.random.randn(10, 1)
    test_data = np.linspace(0, 1, 100).reshape(100, 1)
    np.random.seed(seed_num)
    test_target = np.sin(2 * np.pi * test_data) + 0.01 * np.random.randn(100, 1)
    y_predict_test, E_train, E_test = Polynomial_regression_normal_equation(train_data, train_target, test_data,
                                                                            test_target)
    plt.figure()
    plt.plot(train_data, train_target, 'ro')
    plt.plot(test_data, y_predict_test, 'b-')
    # Set the labels
    font = LabelFormat(plt)
    plt.xlabel('x', font)
    plt.ylabel('y', font)
    plt.legend(['Training target', 'Predicted target,M=2'])
    plt.ylim([-1, 1])
    plt.show()
作者:nineheaded_bird