使用逻辑回归进行MNIST数据集分类
MNIST数据集是机器学习领域中非常经典的一个数据集,由60000个训练样本和10000个测试样本组成,每个样本都是一张28 * 28像素的灰度手写数字图片。
import time
import numpy as np
import matplotlib.pyplot as plt
from sklearn.model_selection import train_test_split
from sklearn.linear_model import LogisticRegression
from sklearn import datasets
from sklearn.preprocessing import StandardScaler
from sklearn.datasets import fetch_openml #从openml.org网站导入数据
from sklearn.utils import check_random_state
t0=time.time()
train_samples=5000
#载入数据集
X, y = fetch_openml('mnist_784', version=1, return_X_y=True)
print(X.shape,y.shape)
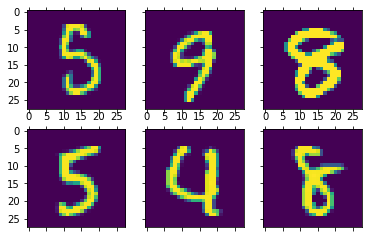
#可视化样本,图形化显示前6个数据
fig,ax=plt.subplots(nrows=2,ncols=3,sharex='all',sharey='all')
ax = ax.flatten()
for i in range(6):
img=X[i].reshape(28,28)
ax[i].matshow(img)
plt.show()

random_state = check_random_state(0)
permutation = random_state.permutation(X.shape[0]) #随机排序序列
X = X[permutation]
y = y[permutation]
X = X.reshape((X.shape[0], -1))
X_train,X_test,y_train,y_test=train_test_split(X,y,train_size=train_samples,test_size=10000)
#数据进行标准化处理
scaler=StandardScaler()
X_train=scaler.fit_transform(X_train)
X_test=scaler.transform(X_test)
#训练模型
clf=LogisticRegression(C=50. / train_samples, penalty='l1', solver='saga', tol=0.1)
clf.fit(X_train,y_train)
score=clf.score(X_test,y_test)
sparsity = np.mean(clf.coef_ == 0) * 100 #稀疏性
print("Sparsity with L1 penalty: %.2f%%" % sparsity)
print("Test score with L1 penalty: %.4f" % score)
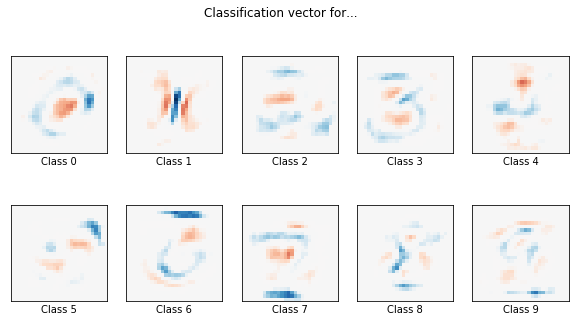
#画图,为什么要给系数画图呢?
coef = clf.coef_.copy()
print(coef.shape)
plt.figure(figsize=(10, 5))
scale = np.abs(coef).max()
for i in range(10):
l1_plot = plt.subplot(2, 5, i + 1)
l1_plot.imshow(coef[i].reshape(28, 28), interpolation='nearest',
cmap=plt.cm.RdBu, vmin=-scale, vmax=scale)
l1_plot.set_xticks(())
l1_plot.set_yticks(())
l1_plot.set_xlabel('Class %i' % i)
plt.suptitle('Classification vector for...')
run_time = time.time() - t0
print('Example run in %.3f s' % run_time)
plt.show()
运行结果
Sparsity with L1 penalty: 58.00%
Test score with L1 penalty: 0.7915
(10, 784)
Example run in 646.503 s

问题:为什么要给系数画图呢?
作者:慢慢悠悠we