复杂网络的可视化分析基础教程详细版(一)
本篇博客讲的是python中复杂网络分析工具network的关于网络中的
节点和边 节点的度 聚集系数 最短距离author:xiao黄 缓慢而坚定的生长
首先导入一些相关的包:
import networkx as nx
import numpy as np # 数值计算
import scipy as sp # 科学计算
import matplotlib.pyplot as plt # 绘图
下面先以美国空手道俱乐部的例子进行讲解:
空手道俱乐部网络是复杂网络分析中常用的一个例子网络,在分析节点中心性和社团结构等问题时都会被使用。因此networkx中也自带空手道俱乐部网。
g = nx.karate_club_graph() # 美国空手道俱乐部
nx.draw(g)
plt.show()
图像显示如下:
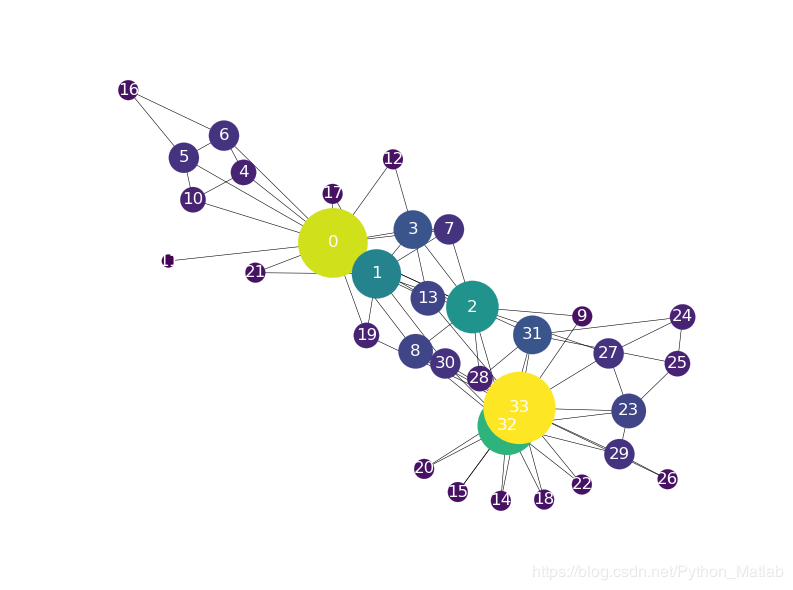
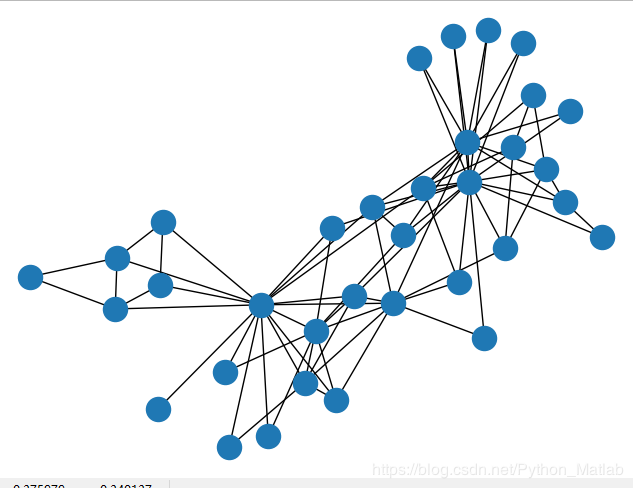 可以对上述的网络进行参数修改等操作,代码如下:
# 可选布局
fig,ax = plt.subplots(figsize=(8,6))
layout = [nx.shell_layout,
          nx.circular_layout,
          nx.fruchterman_reingold_layout,
          nx.circular_layout,
          nx.kamada_kawai_layout,
          nx.spring_layout]
pos = layout[5](g) # 根据布局方式生成每个节点的位置坐标
NodeId = list(g.nodes())
node_size = [g.degree(i)**1.2*90 for i in NodeId]
options = {
           'node_size': node_size,
           'line_color': 'grey',
           'linewidths': 0.1,
           'width': 0.4,
           'node_color': node_size,
           'font_color': 'w' # 字体颜色
           }
nx.draw(g, pos=pos, ax=ax, with_labels=True, **options)
plt.show()
新的显示图像如下:
# 节点的数量
N = g.number_of_nodes()   # len(g.nodes())
# 网络中边的数量
L = g.number_of_edges()   # len(g.edges())
节点的度
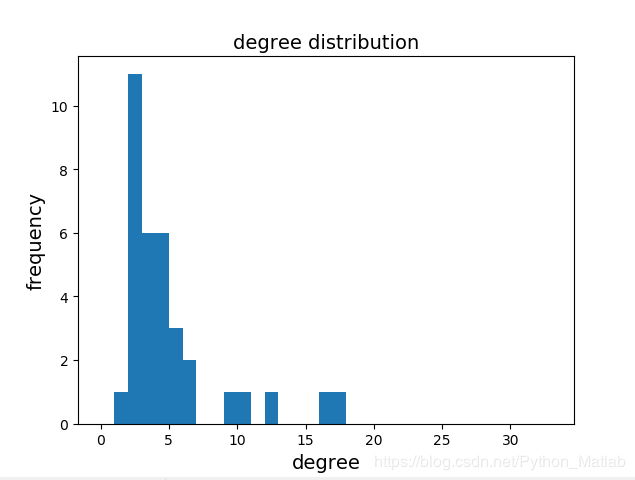
计算网络中所有节点的度,并绘制其度的统计图
# 节点的度
G.degree() # 返回所有节点的度
G.degree(1) # 返回特定节点的度
度分布图的代码如下:
# 度分布图
degs = dict(nx.degree(g))
print('degree of each node:', degs)
print('average degree:', np.mean(list(degs.values())))
# 度分布统计分布图
plt.hist(degs.values(), bins=range(N))
plt.xlabel('degree', fontsize=14)
plt.ylabel('frequency', fontsize=14)
plt.title('degree distribution', fontsize=14)
显示的结果如下:
节点间的最短距离dij表示从节点i最少走多少距离可以到节点j。
下面是一些基本的函数
# 返回特定节点间的最短距离
# nx.shortest_path_length(G,source=1,target=2)
# 返回特定节点与其他所有节点的最短距离
# nx.shortest_path_length(G,source=1)
# 返回所有节点间的最短距离
# nx.shortest_path_length(G)
# 两个节点间的最短距离
d12 = nx.shortest_path_length(G,source=2,target=19)
print('SPL between 2 and 9:',d12)
# 节点间的平均最短距离
avg_d = nx.average_shortest_path_length(G)
print('average SPL:',avg_d)
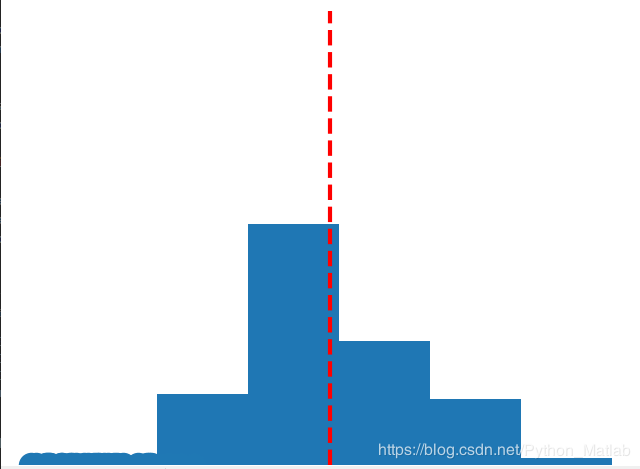
最短距离度分布图代码如下:
avg_d = nx.average_shortest_path_length(G)
# 最短距离分布
pair_d = nx.shortest_path_length(G) # 任意两个节点间的距离
dd = np.array([[nx.shortest_path_length(G,i,j) for j in G if j!=i] for i in G]).reshape(-1)
print(np.mean(dd))
bins = np.arange(-0.5,max(dd)+1.5,1.0)
plt.hist(dd,bins=bins)
plt.plot([avg_d,avg_d],[0,1000],'r--',lw=3)
plt.ylim(0.650)
plt.xlabel('d')
plt.ylabel('frequency')
plt.show()
结果显示如下:
公式基本上都能找到,我这里就不放了
# 集聚系数
# nx.clustering(G) # 返回所有节点的集聚系数
# nx.clustering(G,1) # 返回特定节点的集聚系数
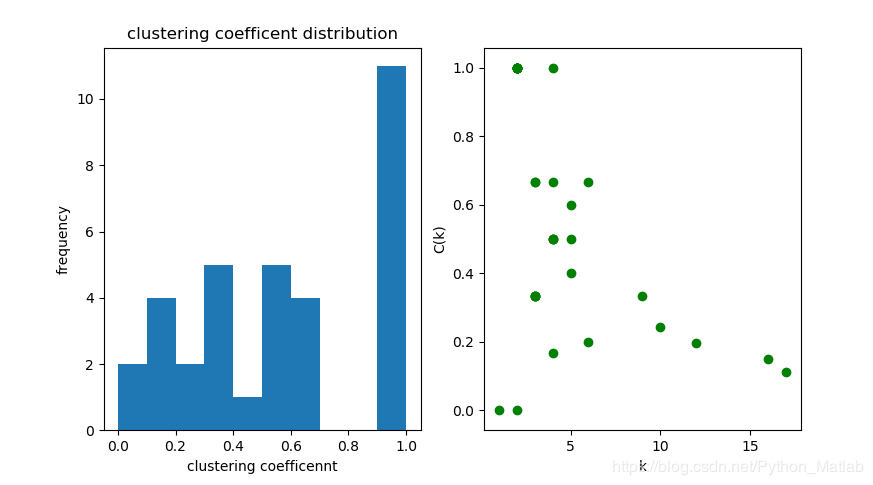
聚集系数 统计分布图
cc = dict(nx.clustering(g))
print('clustering coefficient of each node:', cc)
print('average clustering coefficient:',np.mean(list(cc.values())))
# 统计分布图
plt.figure(figsize=(9,5))
plt.subplot(1,2,1)
plt.hist(cc.values(), bins=10)
plt.xlabel('clustering coefficennt')
plt.ylabel('frequency')
plt.title('clustering coefficent distribution')
# 散点图
plt.subplot(1,2,2)
plt.scatter([degs[i] for i in g], [cc[i] for i in g], c='g')
plt.xlabel('k') # 度数
plt.ylabel('C(k)') # 集聚系数
结果图如下:
作者:xiao黄
相关文章
Kara
2021-05-30
Phyllis
2020-03-22
Dulcea
2023-07-21
Malina
2023-07-21
Tia
2023-07-21
Lida
2023-07-21
Bonnie
2023-07-21
Tia
2023-07-21
Lala
2023-07-21
Glory
2023-07-21
Tallulah
2023-07-21
Crystal
2023-07-21
Kersen
2023-07-21
Bonnie
2023-07-21
Echo
2023-07-22
Phemia
2023-07-22
Pelagia
2023-07-22
Rhoda
2023-07-22