计算机视觉之混合图像(Hybrid images)matlab源码史上最详细注释
在给定数据集上完成以下工作:这项任务的目标是参考简化版论文(the SIGGRAPH 2006 paper by Oliva, Torralba, and Schyns),编写一个图像过滤函数,并使用它来创建混合图像。因为混合图像是静态图像,其解释随观察距离的变化而变化。基本的想法是当高频信号可用时,它往往会主导感知,但在远处,只能看到信号的低频(平滑)部分,于是通过将一幅图像的高频部分与另一幅图像的低频部分混合,可以得到一幅混合图像,该图像在不同距离处可以产生不同的解释。
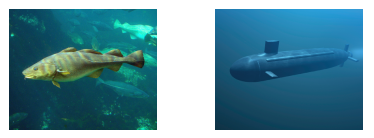
要混合成下图的效果,近距离看是导弹,远距离是鱼:
高斯滤波对图像邻域内像素进行平滑时,邻域内不同位置的像素被赋予不同的权值,对图像进行平滑的同时,同时能够更多的保留图像的总体灰度分布特征。 数值图像处理中,高斯滤波主要可以使用两种方法实现。一种是离散化窗口滑窗卷积,另一种方法是通过傅里叶变化。在这我主要想说说第一种方法的高斯滤波。离散化窗口滑窗卷积的时,主要利用的是高斯核,高斯核一般是一个奇数的大小的高斯模板。
截止频率(高斯模糊的标准偏差),以像素为单位,当振幅增益gain=1/2时定义的频率,fspecial建立一个标准差为cutoff_frequency,尺寸为(cutoff*4+1,1)的滤波模板。
filter = fspecial('Gaussian', [cutoff_frequency*4+1 1], cutoff_frequency);
其中:类型是高斯低通滤波、第二项是模板尺寸(一维滤波),第三项是滤波器的标准差,即截止频率。
对边界采用0填充,将原图像按列排列,方便一维滤波做乘法,一维计算快。
for循环单独过滤每一个通道。滤波模板滑到每一块的时候计算矩阵即可。可以利用matlab内置函数imfilter直接一句搞定,不过低频部分特别特别模糊,测试过但结果不太好。为适用于彩色图像,只需独立过滤每个颜色通道。该过滤器适用于任何高度和宽度的组合,只要高度、宽度是奇数,那么中心像素的位置就是明确的。边界问题:用0填充。
padarray是填充函数,[r ,c]为填充尺寸 中间像素,大小为过滤器尺寸的一半;无填充方法参数 默认用零填充;无填充方向参数 默认both:在每一维的第一个元素前和最后一个元素后填充。
pad_input_image = padarray(intput_image, [(filter_row - 1)/2, (filter_col - 1)/2]);
for layer = 1:size(intput_image, 3)
    % im2col将输入图像的行列按列展开,一块展开成是53个像素,53*1
    % 模板滑到的一块区域按列存储,方便和模板进行矩阵计算
    columns = im2col(pad_input_image(:,:,layer), [filter_row, filter_col]);
    % 卷积,滤波模板乘以每一列,得到的就是输出图像
    filterd_columns = filter’* columns;
    % col2im是从列恢复到原图像尺寸
    output(:,:,layer) = col2im(filterd_columns, [1, 1], [intput_row, intput_col]);
end
2.2 混合图像流程
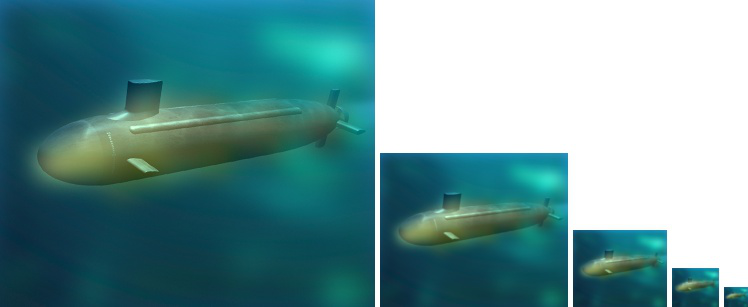
在本实验中,我们采用高斯低通过滤的方法得到低频部分,通过原图减低频信号部分得到高频,进而将两张图片混合得到结果并输出。具体流程如下图3:
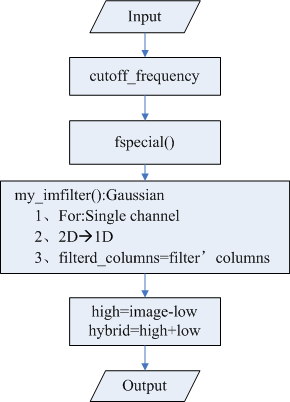
a 输入图片
b 分配数据:将数据集两两配对,bird与plane、cat与dog、motocycle与bicycle、fish与submarine、marilyn与einstein
c 手动选择图像两点进行对齐操作
d 设置相关参数
e 计算高斯模板
f 将图像进入高斯低频通道进行过滤,得到低频信号部分
g 计算高频信号
h 混合两张图像,并将结果输出
%readme
软件版本:Matlab R2014b
proj1.m 是主函数
my_imfilter.m 是过滤函数(用的高斯低频过滤)
vis_hybrid_image.m 是对混合图像下采样,方便查看结果
proj1_test_filtering.m 是采用了6种过滤方法对my_imfilter过滤函数测试,
  可以比较不同模板过滤出来的效果
alig.m 是图像对齐函数,主函数中调用已注释,运行需要修改一下
data应与code在同一路径下并列
直接运行proj1.m可得到结果
运行proj1_test_filtering.m 可以得到不同方法的过滤效果图
主函数proj1.m
close all;
%% 主函数流程:
%1.输入图像 设置参数 建立滤波算子
%2.对图1低通过滤,对图2高通过滤
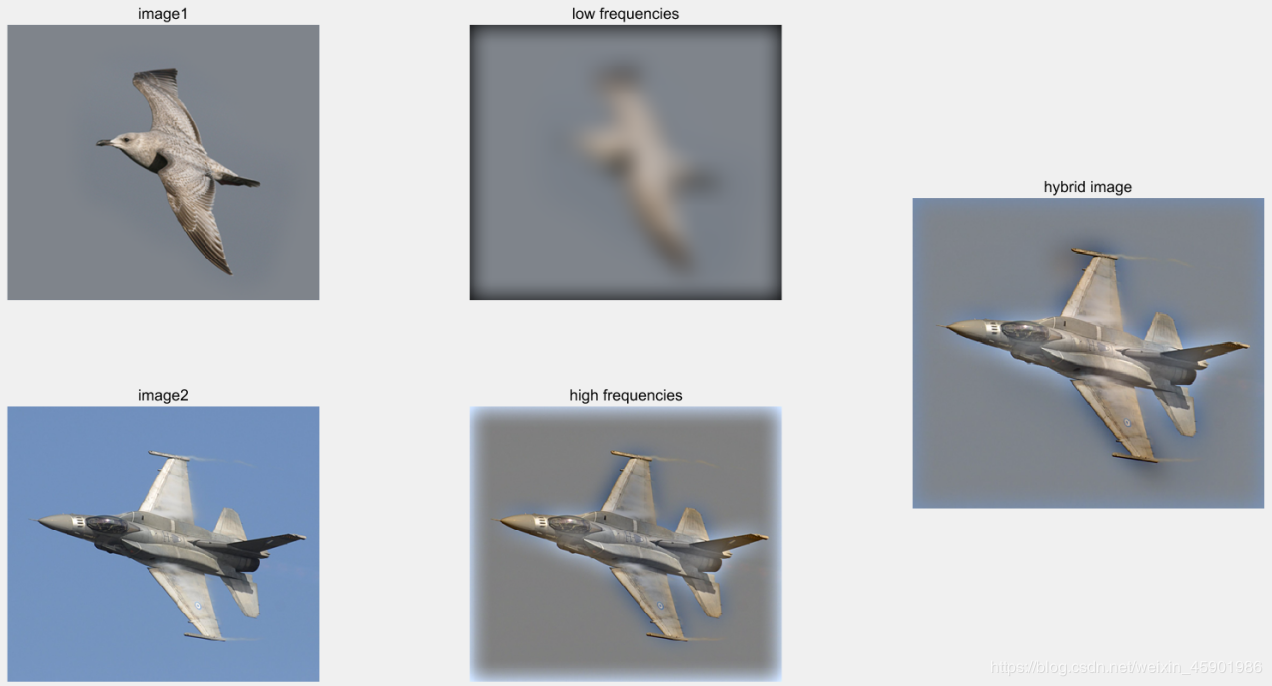
%3.合成hybrid图片,输出结果(第一个窗口包括原图、低、高频图和混合图,第二个窗口是缩小图像尺寸的图)
%对齐操作
%[image1,image2]=alignment();
%% 输入图片
%imread返回图像类型是uint8,矩阵范围为0--255
%im2single将图片转换成单精度数,范围是0--1
image1 = im2single(imread('../data/bicycle.bmp'));
image2 = im2single(imread('../data/motorcycle.bmp'));
%% Filtering and Hybrid Image construction
%截止频率(高斯模糊的标准偏差),以像素为单位,当振幅增益gain=1/2时定义的频率
cutoff_frequency = 13;
%fspecial建立一个标准差为cutoff_frequency,尺寸为(cutoff*4+1,1)的滤波模板;
%原理公式可见:https://www.cnblogs.com/bingdaocaihong/p/7007346.html
%fspecial函数c语言实现:https://blog.csdn.net/xizero00/article/details/8595781
%其中:类型是高斯低通滤波、第二项是模板尺寸(一维滤波),第三项是滤波器的标准差,即截止频率
filter = fspecial('Gaussian', [cutoff_frequency*4+1 1], cutoff_frequency);
%对image1进行低通过滤,得到图1的低频部分
%low_frequencies= imfilter(image1, filter);
%卷积算子是对称矩阵,将其分解成一个矩阵与其转置的乘积
%先后与原图进行卷积,减少计算次数
low_frequencies = my_imfilter(my_imfilter(image1, filter), filter');
%得到图2的高频部分。对image2进行低通过滤,得到图2的低频部分,用image2减低频即为高频部分
%high_frequencies= image2-imfilter(image2, filter);
high_frequencies = image2 - my_imfilter(my_imfilter(image2, filter), filter');
%hybrid image(图1的低频+图2的高频)
hybrid_image = low_frequencies + high_frequencies;
%% 保存和输出结果
subplot(2,3,1)
imshow(image1);
title('image1');
%输出图1的低频部分
subplot(2,3,2)
imshow(low_frequencies);
title('low frequencies');
subplot(2,3,4)
imshow(image2);
title('image2');
%输出图2的低频部分
%imshow的数据范围是0--1
%high_frequencies+0.5的原因:
%原图四周较黑,高通过滤后,四周提取到的特征会很少,显示会很黑,影响观察结果
%加上0.5后便于观察(加合适的值也可以)
subplot(2,3,5)
imshow(high_frequencies+0.5);
title('high frequencies');
%显示混合图片
subplot(2,3,[3 6])
imshow(hybrid_image);
title('hybrid image');
%缩小显示混合图片,方便比对结果
vis = vis_hybrid_image(hybrid_image);
figure(2); imshow(vis);
title('hybrid image downsampling:');
%在当前目录保存结果为jpg文件
imwrite(low_frequencies, 'low_frequencies.jpg', 'quality', 95);
imwrite(high_frequencies + 0.5, 'high_frequencies.jpg', 'quality', 95);
imwrite(hybrid_image, 'hybrid_image.jpg', 'quality', 95);
imwrite(vis, 'hybrid_image_scales.jpg', 'quality', 95);
滤波函数my_imfilter.m
function output = my_imfilter(image, filter)
%% 过滤函数思路
%对边界采用0填充,将原图像按列排列,方便一维滤波做乘法,一维计算快
%for循环单独过滤每一个通道
%滤波模板滑到每一块的时候计算矩阵即可
%% 可以利用matlab内置函数imfilter直接一句搞定,不过低频部分特别特别模糊,结果不太好
    %output = imfilter(image, filter);
%为适用于彩色图像,只需独立过滤每个颜色通道。
%该过滤器适用于任何高度和宽度的组合,只要高度、宽度是奇数,那么中心像素的位置就是明确的。
%边界问题:用0填充
%%
intput_image = image;
%输入图片的行和列331*375
[intput_row, intput_col] = size(intput_image(:,:,1));
%过滤模板的行和列53*1
[filter_row, filter_col] = size(filter);
%padarray是填充函数,[r ,c]为填充尺寸 中间像素,大小为过滤器尺寸的一半
%无填充方法参数 默认用零填充;无填充方向参数 默认both:在每一维的第一个元素前和最后一个元素后填充
pad_input_image = padarray(intput_image, [(filter_row - 1)/2, (filter_col - 1)/2]);
output = [];
for layer = 1:size(intput_image, 3) % 独立过滤每一层通道
    % im2col将输入图像的行列按列展开,一块展开成是53个像素,53*1
    % 模板滑到的一块区域按列存储,方便和模板进行矩阵计算
    columns = im2col(pad_input_image(:,:,layer), [filter_row, filter_col]);
    % transpose是转置函数
    filter2 = transpose(filter(:));
    % 矩阵乘法,滤波模板乘以每一列,得到的就是输出图像
    filterd_columns = filter2 * columns;
    % col2im是从列恢复到原图像尺寸
    output(:,:,layer) = col2im(filterd_columns, [1, 1], [intput_row, intput_col]);
end
显示混合结果函数vis_hybrid_image.m
function output = vis_hybrid_image(hybrid_image)
%% 成倍缩小4次混合图像,最后的结果output是一张图,方便从不同距离观察结果,白色区域是用零填充的
%对混合图像进行下采样
%下采样又称缩小图像
scales = 5; %缩小4次
scale_factor = 0.5; %每次缩小2倍
padding = 5; %填充5个像素用于图片间隔
original_height = size(hybrid_image,1); %图像的行数
num_colors = size(hybrid_image,3); %图像的通道数
output = hybrid_image;
cur_image = hybrid_image;
for i = 2:scales  %缩小4次
    %填充5列像素,2指按行合并两个矩阵
    %填充的像素值是1(白色)
    output = cat(2, output, ones(original_height, padding, num_colors));
    %imresize命令是下采样操作。将cur_image缩小1/scale_factor倍,bilinear采用双线性插值法
    %双线性插值法:https://www.cnblogs.com/snow826520/p/9267837.html
    cur_image = imresize(cur_image, scale_factor, 'bilinear');
    %1指按列合并两个矩阵,上面是白色,下面是缩小后的图
    tmp = cat(1,ones(original_height - size(cur_image,1), size(cur_image,2), num_colors), cur_image);
    %将前一output和此时缩小图tmp按行合并
    output = cat(2, output, tmp);
end
比较6种不同的滤波proj1_test_filtering.m
%% 对自己写的my_imfilter进行过滤测试(6种不同方法)
%1、自定义 [0 0 0; 0 1 0; 0 0 0]
%2、box filter[1 1 1; 1 1 1; 1 1 1]  像是均值滤波
%3、低通滤波器(高斯模糊)
%4、定向滤波器 (Sobel算子) 一种高通
%5、高通滤波器 (离散拉普拉斯Laplacian)
%6、简单的高通滤波(直接原图减去高斯模糊的低频部分)
close all
picture_name = 'bird';
picture_format = '.bmp';
%% Setup
test_image = im2single(imread(strcat('../data/', picture_name, picture_format)));  %读图
%缩小原图尺寸输出
figure(1)
imshow(test_image)
title('original image');
%% Identify filter
%This filter no change
identity_filter = [0 0 0; 0 1 0; 0 0 0];
identity_image  = my_imfilter(test_image, identity_filter);
figure(2); imshow(identity_image);
title('center=1');
mkdir(strcat('../data/', picture_name));
imwrite(identity_image, strcat('../data/', picture_name, '/identity_image.jpg'), 'quality', 95);
%% Small blur with
%This box filter 除去一些高频部分
blur_filter = [1 1 1; 1 1 1; 1 1 1];
blur_filter = blur_filter / sum(sum(blur_filter)); %making the filter sum to 1
blur_image = my_imfilter(test_image, blur_filter);
figure(3); imshow(blur_image);
title('small blur image');
imwrite(blur_image, strcat('../data/', picture_name, '/small_blur_image.jpg'), 'quality', 95);
%% Large blur
%高斯模糊
large_1d_blur_filter = fspecial('Gaussian', [25 1], 10);
large_blur_image = my_imfilter(test_image, large_1d_blur_filter);
large_blur_image = my_imfilter(large_blur_image, large_1d_blur_filter');
figure(4); imshow(large_blur_image);
title('Gaussian blur');
imwrite(large_blur_image, strcat('../data/', picture_name, '/Gaussian_blur_image.jpg'), 'quality', 95);
%% 定向滤波器 (Sobel 算子)高通滤波
sobel_filter = [-1 0 1; -2 0 2; -1 0 1]; %should respond to horizontal gradients
sobel_image = my_imfilter(test_image, sobel_filter);
figure(5); imshow(sobel_image + 0.5);
title('sobel operator');
imwrite(sobel_image + 0.5, strcat('../data/', picture_name, '/sobel_image.jpg'), 'quality', 95);
%% 高通滤波器 (离散拉普拉斯Laplacian)
laplacian_filter = [0 1 0; 1 -4 1; 0 1 0];
laplacian_image = my_imfilter(test_image, laplacian_filter);
figure(6); imshow(laplacian_image + 0.5);
title('laplacian image');
imwrite(laplacian_image + 0.5, strcat('../data/', picture_name, '/laplacian_image.jpg'), 'quality', 95);
%% High pass "filter" alternative  原图减去低通滤波解决的东西
high_pass_image = test_image - large_blur_image; %simply subtract the low frequency content
figure(7); imshow(high_pass_image+0.5);
title('simply sub low-frequencies');
imwrite(high_pass_image + 0.5, strcat('../data/', picture_name, '/simply_high_pass_image.jpg'), 'quality', 95);
对齐函数(可用可不用)alig.m
function [image1,image2]=alignment( )
img1 = im2single(imread('../data/cat.bmp'));
img2 = im2single(imread('../data/dog.bmp'));
% img1 = rgb2gray(img1);  % convert to grayscale
% img2 = rgb2gray(img2);
% Align the two images, e.g. by the eyes. (translation, scale, rotation)
[h1, w1, c1] = size(img1);  % get image size
[h2, w2, c2] = size(img2);
disp('Select two points from each image define rotation, scale, trans.')
figure(1), hold off, imagesc(img1), axis image, colormap default;
[x1, y1] = ginput(2);
cx1 = mean(x1); cy1 = mean(y1);
figure(1), hold off, imagesc(img2), axis image;  % displays image
[x2, y2] = ginput(2);
cx2 = mean(x2); cy2 = mean(y2);
tx = round((w1/2-cx1)*2);  % translate first so that center of ref points
if tx > 0, img1 = padarray(img1, [0 tx], 'pre');     % is center of image
else,      img1 = padarray(img1, [0 -tx], 'post'); end
ty = round((h1/2-cy1)*2);
if ty > 0, img1 = padarray(img1, [ty 0], 'pre');
else,      img1 = padarray(img1, [-ty 0], 'post'); end
tx = round((w2/2-cx2)*2);
if tx > 0,  img2 = padarray(img2, [0 tx], 'pre');
else,       img2 = padarray(img2, [0 -tx], 'post'); end
ty = round((h2/2-cy2)*2);
if ty > 0,  img2 = padarray(img2, [ty 0], 'pre');
else,       img2 = padarray(img2, [-ty 0], 'post'); end
len1 = sqrt((y1(2)-y1(1)).^2+(x1(2)-x1(1)).^2);  % downscale larger image
len2 = sqrt((y2(2)-y2(1)).^2+(x2(2)-x2(1)).^2);  % so that lengths between
dscale = len2 ./ len1;                           % ref point are the same
if dscale < 1, img1 = imresize(img1, dscale, 'bilinear');
else,          img2 = imresize(img2, 1./dscale, 'bilinear'); end
theta1 = atan2(-(y1(2)-y1(1)), x1(2)-x1(1));
theta2 = atan2(-(y2(2)-y2(1)), x2(2)-x2(1));
dtheta = theta2 - theta1;                              % imrotate
img1 = imrotate(img1, dtheta*180/pi, 'bilinear');      % uses degree units
[h1, w1, c1] = size(img1);
[h2, w2, c2] = size(img2);
minw = min(w1,w2);
brd = (max(w1,w2)-minw)/2;
if minw == w1
    img2 = img2(:, ceil(brd)+1:end-floor(brd), :);
    tx = tx - ceil(brd);
else
    img1 = img1(:, ceil(brd)+1:end-floor(brd), :);
    tx = tx + ceil(brd);
end
minh = min(h1,h2);
brd = (max(h1,h2)-minh)/2;
if minh == h1
    img2 = img2(ceil(brd)+1:end-floor(brd), :, :);
    ty = ty - ceil(brd);
else
    img1 = img1(ceil(brd)+1:end-floor(brd), :, :);
    ty = ty + ceil(brd);
end
image1=img1;
image2=img2;
end
4.结果
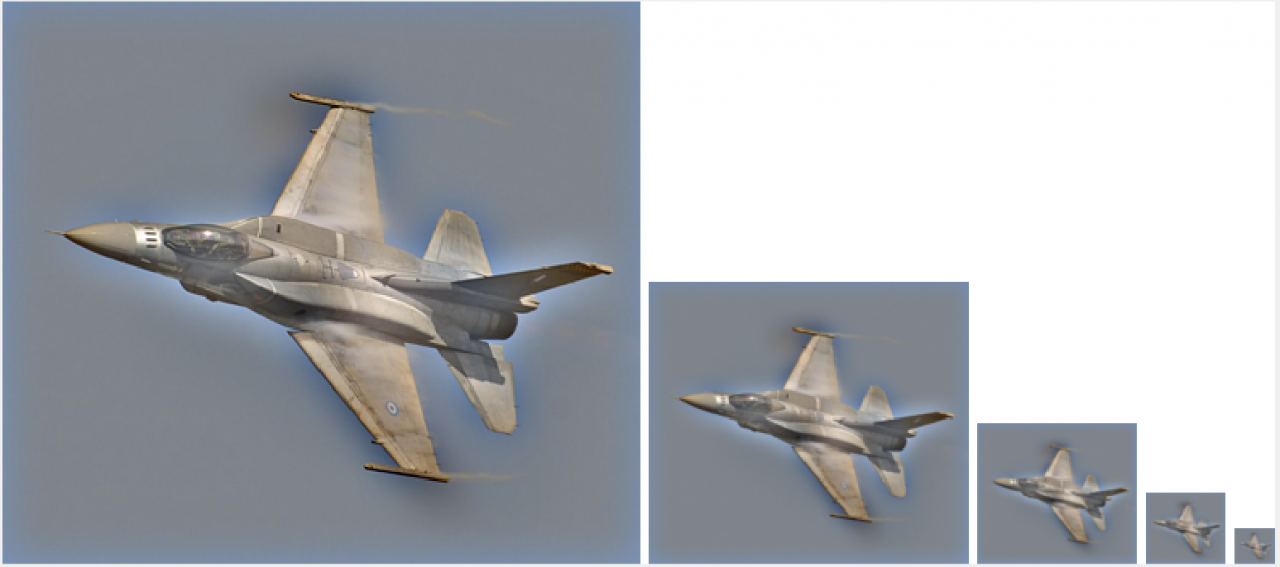
将一幅图像的高频部分与另一幅图像的低频部分混合,可以得到一幅混合图像,该图像在不同距离处可以产生不同的解释:(brid与plane混合结果图)
brid与plane混合图下采样结果:
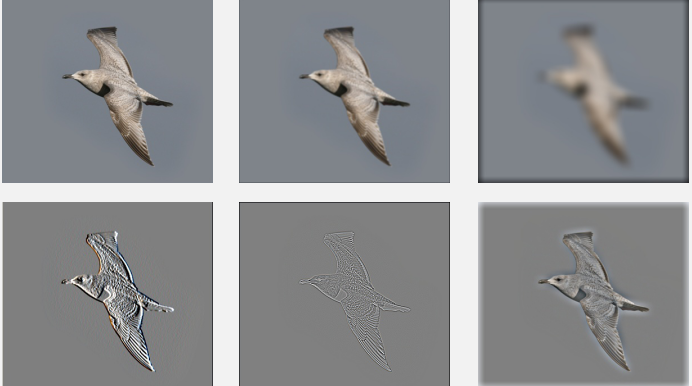
6种滤波对比结果:
1、自定义[0 0 0; 0 1 0; 0 0 0] 就是原图;
2、均值滤波[1 1 1; 1 1 1; 1 1 1] ;
3、低通滤波器(高斯模糊);
4、一种高通定向滤波器 (Sobel算子) ;
5、高通滤波器 (离散拉普拉斯);
6、简单的高通滤波(直接原图减去高斯模糊的低频部分),
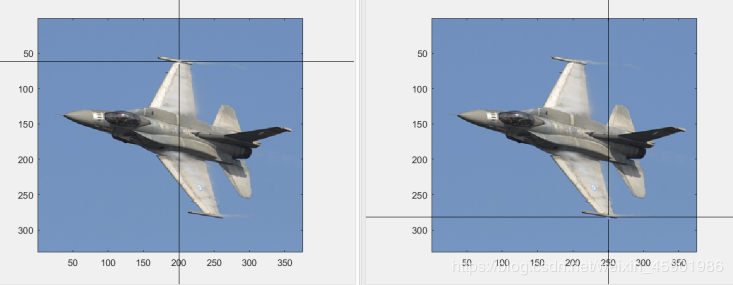
两点对齐操作的测试结果:
(我挑选了鸟翅膀和机翼的两点)

下面是结果:
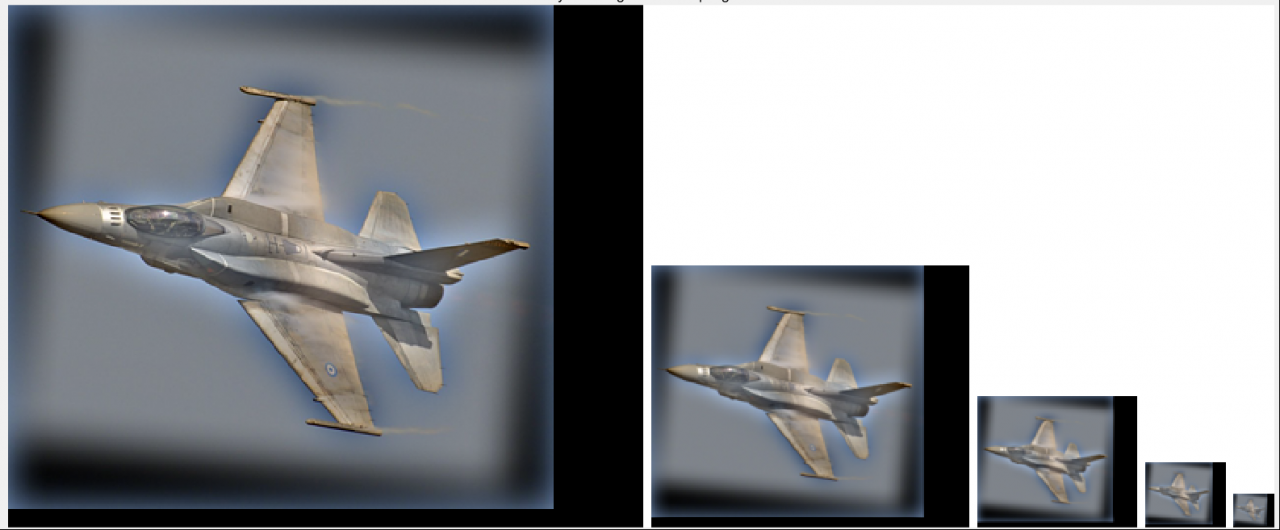
Too bad!分析一下原因:
通过观察可发现,对齐操作存在以下几个不足之处:
1、背景填充的问题。由于为了对齐,进行平移、旋转变换,需要扩大图片大小,而这默认是0填充,出来效果不太好。
2、需要人工选择对齐点,有的图片有明显特征点可作为选择的点,比如上面图中的鸟翼和机翼,但有的图像没有,太主观。
3、因为本次实验的数据集提供的图片,每组大小尺寸特征点也比较一致,已经对齐挺好,出来的结果与没对齐差距不大。
cutoff_frequency截止频率。
不同的cutoff_frequency对混合效果产生很大的不同,
如果不用手动调试,如何能找到一个最佳的截止频率?
(ps:实验做过挺久了,参考了一些博主的文章,若有博主介意私信我一一列举。)
作者:R__Chen