KaggleM5 Forecasting:传统预测方法与机器学习预测方法对比
本文的出发点在于比较传统预测方法和机器学习预测方法。
本文使用的数据集来自 kaggle:M5 Forecasting — Accuracy。
该数据集包含有 California、Texas、Wisconsin 三个州的产品类别、部门、仓储信息等。基于这些数据,需要预测接下来 28 天的每日销售量。
涉及到的方法有:
单指数平滑法 双指数平滑法 三指数平滑法 ARIMA SARIMA SARIMAX Light Gradient Boosting Random Forest Linear Regression为了使用上述方法,首先导入相应的包/库:
import time
import warnings
import numpy as np
import pandas as pd
import seaborn as sns
import lightgbm as lgb
from itertools import cycle
from sklearn.svm import SVR
import statsmodels.api as sm
from pmdarima import auto_arima
import matplotlib.pyplot as plt
from datetime import datetime, timedelta
from sklearn.metrics import mean_squared_error
from sklearn.linear_model import LinearRegression
from sklearn.ensemble import RandomForestRegressor
from statsmodels.graphics.tsaplots import plot_acf
from statsmodels.tsa.holtwinters import SimpleExpSmoothing, ExponentialSmoothing
%matplotlib inline
plt.style.use('bmh')
sns.set_style("whitegrid")
plt.rc('xtick', labelsize=15)
plt.rc('ytick', labelsize=15)
warnings.filterwarnings("ignore")
pd.set_option('max_colwidth', 100)
pd.set_option('display.max_rows', 500)
pd.set_option('display.max_columns', 500)
color_pal = plt.rcParams['axes.prop_cycle'].by_key()['color']
color_cycle = cycle(plt.rcParams['axes.prop_cycle'].by_key()['color'])
然后导入数据集:
data = pd.read_csv('data_for_tsa.csv')
data['date'] = pd.to_datetime(data['date'])
data.head()
数据集前五行数据

数据集包含了 2011-01-29 到 2016-05-22 期间的 1941 天的数据。其中最后 28 天作为测试集。
预测目标是 demand,即:当日的产品销售量。
接下来进行数据集划分
测试集包含了 2016-03-27 到 2016-04-24 期间的 28 天的数据。
2016-03-27 之前的其他数据则作为训练数据。
train = data[data['date']  '2016-03-27') & (data['date'] <= '2016-04-24')]
fig, ax = plt.subplots(figsize=(25,5))
train.plot(x='date',y='demand',label='Train',ax=ax)
test.plot(x='date',y='demand',label='Test',ax=ax);
时间序列数据

为了便于对比所有方法的准确性,建立一个命名为 predictions 的 dataframe,将每个方法设为其中的一行。建立一个命名为stats的 dataframe,用于存储每个方法的性能表现和计算时间。
predictions = pd.DataFrame()
predictions['date'] = test['date']
stats = pd.DataFrame(columns=['Model Name','Execution Time','RMSE'])
训练及评价模型
单指数平滑方法
通过调用 SimpleExpSmoothing 包,可以使用 EWMA, Exponentially Weighted Moving Average方法——一种单指数平滑方法。
使用 EWMA 方法,我们首先需要定义 span 变量——数据集的季节周期。
fig, ax = plt.subplots(figsize=(15, 3))
plot_acf(data['demand'].tolist(), lags=60, ax=ax);
自相关图

查看数据的自相关图可知,每隔七个数据,达到一个峰值,也就意味着任一数据与之前的第七个时间数据具有较高的相关性。所以这里将 span 设为 7。
具体地,通过以下代码实现单指数平滑方法预测:
t0 = time.time()
model_name='Simple Exponential Smoothing'
span = 7
alpha = 2/(span+1)
#train
simpleExpSmooth_model = SimpleExpSmoothing(train['demand']).fit(smoothing_level=alpha,optimized=False)
t1 = time.time()-t0
#predict
predictions[model_name] = simpleExpSmooth_model.forecast(28).values
#visualize
fig, ax = plt.subplots(figsize=(25,4))
train[-28:].plot(x='date',y='demand',label='Train',ax=ax)
test.plot(x='date',y='demand',label='Test',ax=ax);
predictions.plot(x='date',y=model_name,label=model_name,ax=ax);
#evaluate
score = np.sqrt(mean_squared_error(predictions[model_name].values, test['demand']))
print('RMSE for {}: {:.4f}'.format(model_name,score))
stats = stats.append({'Model Name':model_name, 'Execution Time':t1, 'RMSE':score},ignore_index=True)
单指数平滑方法预测结果

上述代码实现了对于数据的学习,通过 forcast(x),x=28,预测了接下来 28 天的数据。并且通过均方根误差衡量误差。
单指数平滑方法只使用了一个平滑系数 α\alphaα,而双指数平滑方法则引入了第二个平滑系数 β\betaβ,以反映数据的趋势。
使用双指数平滑方法,我们需要定义 seasonal_periods。
具体代码如下:
t0 = time.time()
model_name='Double Exponential Smoothing'
#train
doubleExpSmooth_model = ExponentialSmoothing(train['demand'],trend='add',seasonal_periods=7).fit()
t1 = time.time()-t0
#predict
predictions[model_name] = doubleExpSmooth_model.forecast(28).values
#visualize
fig, ax = plt.subplots(figsize=(25,4))
train[-28:].plot(x='date',y='demand',label='Train',ax=ax)
test.plot(x='date',y='demand',label='Test',ax=ax);
predictions.plot(x='date',y=model_name,label=model_name,ax=ax);
#evaluate
score = np.sqrt(mean_squared_error(predictions[model_name].values, test['demand']))
print('RMSE for {}: {:.4f}'.format(model_name,score))
stats = stats.append({'Model Name':model_name, 'Execution Time':t1, 'RMSE':score},ignore_index=True)
双指数平滑方法预测结果

三指数平滑方法进一步引入了系数以反映数据的趋势及季节性变化。
具体代码如下:
t0 = time.time()
model_name='Triple Exponential Smoothing'
#train
tripleExpSmooth_model = ExponentialSmoothing(train['demand'],trend='add',seasonal='add',seasonal_periods=7).fit()
t1 = time.time()-t0
#predict
predictions[model_name] = tripleExpSmooth_model.forecast(28).values
#visualize
fig, ax = plt.subplots(figsize=(25,4))
train[-28:].plot(x='date',y='demand',label='Train',ax=ax)
test.plot(x='date',y='demand',label='Test',ax=ax);
predictions.plot(x='date',y=model_name,label=model_name,ax=ax);
#evaluate
score = np.sqrt(mean_squared_error(predictions[model_name].values, test['demand']))
print('RMSE for {}: {:.4f}'.format(model_name,score))
stats = stats.append({'Model Name':model_name, 'Execution Time':t1, 'RMSE':score},ignore_index=True)
三指数平滑方法预测结果

从预测结果可以看出,三指数平滑方法能够学习数据的季节性变化特征。
使用 ARIMA 方法,首先需要确定 p,d,q 三个参数。
p 是AR项的顺序。
d 是使时间序列平稳所需的差分次数
q 是MA项的顺序。
自动确定 ARIMA 所需参数
通过调用 auto_arima 包,可以自动确定 ARIMA 所需的参数。
t0 = time.time()
model_name='ARIMA'
arima_model = auto_arima(train['demand'], start_p=0, start_q=0,
                          max_p=14, max_q=3,
                          seasonal=False,
                          d=None, trace=True,random_state=2020,
                          error_action='ignore',   # we don't want to know if an order does not work
                          suppress_warnings=True,  # we don't want convergence warnings
                          stepwise=True)
arima_model.summary()
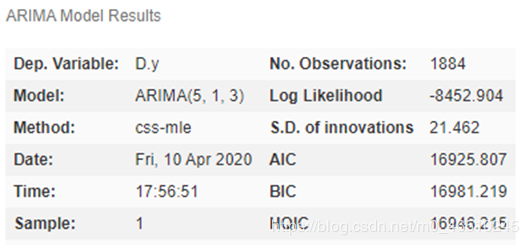
auto_arima 的计算结果

确定了 p,d,q 参数,就可以进行下一步的训练及预测:
#train
arima_model.fit(train['demand'])
t1 = time.time()-t0
#predict
predictions[model_name] = arima_model.predict(n_periods=28)
#visualize
fig, ax = plt.subplots(figsize=(25,4))
train[-28:].plot(x='date',y='demand',label='Train',ax=ax)
test.plot(x='date',y='demand',label='Test',ax=ax);
predictions.plot(x='date',y=model_name,label=model_name,ax=ax);
#evaluate
score = np.sqrt(mean_squared_error(predictions[model_name].values, test['demand']))
print('RMSE for {}: {:.4f}'.format(model_name,score))
stats = stats.append({'Model Name':model_name, 'Execution Time':t1, 'RMSE':score},ignore_index=True)
ARIMA 预测结果

这里使用的简单ARIMA模型不考虑季节性,是一个(5,1,3)模型。这意味着它使用5个滞后来预测当前值。移动窗口的大小等于 1,即滞后预测误差的数量等于1。使时间序列平稳所需的差分次数为 3。
SARIMA 是 ARIMA 的发展,进一步引入了相关参数以使得模型能够反映数据的季节变化特征。
通过 auto_arima 相关代码,将参数设置为 seasonal=True,m=7,自动计算 SARIMA 所需的参数。
t0 = time.time()
model_name='SARIMA'
sarima_model = auto_arima(train['demand'], start_p=0, start_q=0,
                          max_p=14, max_q=3,
                          seasonal=True, m=7,
                          d=None, trace=True,random_state=2020,
                          out_of_sample_size=28,
                          error_action='ignore',   # we don't want to know if an order does not work
                          suppress_warnings=True,  # we don't want convergence warnings
                          stepwise=True)
sarima_model.summary()
auto_arima 计算结果

确定了参数后,接下来进行训练及预测:
#train
sarima_model.fit(train['demand'])
t1 = time.time()-t0
#predict
predictions[model_name] = sarima_model.predict(n_periods=28)
#visualize
fig, ax = plt.subplots(figsize=(25,4))
train[-28:].plot(x='date',y='demand',label='Train',ax=ax)
test.plot(x='date',y='demand',label='Test',ax=ax);
predictions.plot(x='date',y=model_name,label=model_name,ax=ax);
#evaluate
score = np.sqrt(mean_squared_error(predictions[model_name].values, test['demand']))
print('RMSE for {}: {:.4f}'.format(model_name,score))
stats = stats.append({'Model Name':model_name, 'Execution Time':t1, 'RMSE':score},ignore_index=True)
SARIMA 预测结果

使用前面的方法,我们只能基于前面的历史数据进行预测。在 SARIMAX 中引入外生回归因子(eXogenous regressors),可以实现对时间序列数据以外的数据的分析。
本例中,我们引入 sell_price 数据以辅助更好地预测。
t0 = time.time()
model_name='SARIMAX'
sarimax_model = auto_arima(train['demand'], start_p=0, start_q=0,
                          max_p=14, max_q=3,
                          seasonal=True, m=7,
                          exogenous = train[['sell_price']].values,
                          d=None, trace=True,random_state=2020,
                          out_of_sample_size=28,
                          error_action='ignore',   # we don't want to know if an order does not work
                          suppress_warnings=True,  # we don't want convergence warnings
                          stepwise=True)
sarimax_model.summary()
auto_arima 计算结果

通过 auto_arima 自动计算了 SARIMAX 方法所需的参数后,可以直接进行训练和预测。
#train
sarimax_model.fit(train['demand'])
t1 = time.time()-t0
#predict
predictions[model_name] = sarimax_model.predict(n_periods=28)
#visualize
fig, ax = plt.subplots(figsize=(25,4))
train[-28:].plot(x='date',y='demand',label='Train',ax=ax)
test.plot(x='date',y='demand',label='Test',ax=ax);
predictions.plot(x='date',y=model_name,label=model_name,ax=ax);
#evaluate
score = np.sqrt(mean_squared_error(predictions[model_name].values, test['demand']))
print('RMSE for {}: {:.4f}'.format(model_name,score))
stats = stats.append({'Model Name':model_name, 'Execution Time':t1, 'RMSE':score},ignore_index=True)
SARIMAX 预测结果

从预测结果可以看出,通过分析额外的数据,有助于减少误差。
使用机器学习方法,首先需要特征数据以及指标数据。
在本文中,基于时间序列数据构造特征数据如下:
特征数据1:滞后数据。 选择 7 天前的demand 数据作为特征数据。
特征数据2:移动平均数据。选择 7 天前至 14 天之前的 demand 移动平均值数据作为特征数据。
特征数据3:月销售均值
特征数据4:每月销售最大值
特征数据5:每月销售最小值
特征数据6:每月销售最大值与最小值的差值
特征数据7:每周销售均值
特征数据8:每周销售最大值
特征数据9:每周销售中值
具体代码如下:
def lags_windows(df):
    lags = [7]
    lag_cols = ["lag_{}".format(lag) for lag in lags ]
    for lag, lag_col in zip(lags, lag_cols):
        df[lag_col] = df[["id","demand"]].groupby("id")["demand"].shift(lag)
    wins = [7]
    for win in wins :
        for lag,lag_col in zip(lags, lag_cols):
            df["rmean_{}_{}".format(lag,win)] = df[["id", lag_col]].groupby("id")[lag_col].transform(lambda x : x.rolling(win).mean())
    return df
def per_timeframe_stats(df, col):
    #For each item compute its mean and other descriptive statistics for each month and dayofweek in the dataset
    months = df['month'].unique().tolist()
    for y in months:
        df.loc[df['month'] == y, col+'_month_mean'] = df.loc[df['month'] == y].groupby(['id'])[col].transform(lambda x: x.mean()).astype("float32")
        df.loc[df['month'] == y, col+'_month_max'] = df.loc[df['month'] == y].groupby(['id'])[col].transform(lambda x: x.max()).astype("float32")
        df.loc[df['month'] == y, col+'_month_min'] = df.loc[df['month'] == y].groupby(['id'])[col].transform(lambda x: x.min()).astype("float32")
        df[col + 'month_max_to_min_diff'] = (df[col + '_month_max'] - df[col + '_month_min']).astype("float32")
    dayofweek = df['dayofweek'].unique().tolist()
    for y in dayofweek:
        df.loc[df['dayofweek'] == y, col+'_dayofweek_mean'] = df.loc[df['dayofweek'] == y].groupby(['id'])[col].transform(lambda x: x.mean()).astype("float32")
        df.loc[df['dayofweek'] == y, col+'_dayofweek_median'] = df.loc[df['dayofweek'] == y].groupby(['id'])[col].transform(lambda x: x.median()).astype("float32")
        df.loc[df['dayofweek'] == y, col+'_dayofweek_max'] = df.loc[df['dayofweek'] == y].groupby(['id'])[col].transform(lambda x: x.max()).astype("float32")
    return df
def feat_eng(df):
    df = lags_windows(df)
    df = per_timeframe_stats(df,'demand')
    return df
准备数据:
data = pd.read_csv('data_for_tsa.csv')
data['date'] = pd.to_datetime(data['date'])
train = data[data['date']  '2016-03-11') & (data['date'] <= '2016-04-24')]
data_ml = feat_eng(train)
data_ml = data_ml.dropna()
useless_cols = ['id','item_id','dept_id','cat_id','store_id','state_id','demand','date','demand_month_min']
linreg_train_cols = ['sell_price','year','month','dayofweek','lag_7','rmean_7_7'] #use different columns for linear regression
lgb_train_cols = data_ml.columns[~data_ml.columns.isin(useless_cols)]
X_train = data_ml[lgb_train_cols].copy()
y_train = data_ml["demand"]
模型拟合
通过 light gradient boosting、linear regression、random forest 三种方法对数据进行拟合:
#Fit Light Gradient Boosting
t0 = time.time()
lgb_params = {
        "objective" : "poisson",
        "metric" :"rmse",
        "force_row_wise" : True,
        "learning_rate" : 0.075,
        "sub_row" : 0.75,
        "bagging_freq" : 1,
        "lambda_l2" : 0.1,
        'verbosity': 1,
        'num_iterations' : 2000,
        'num_leaves': 128,
        "min_data_in_leaf": 50,
}
np.random.seed(777)
fake_valid_inds = np.random.choice(X_train.index.values, 365, replace = False)
train_inds = np.setdiff1d(X_train.index.values, fake_valid_inds)
train_data = lgb.Dataset(X_train.loc[train_inds] , label = y_train.loc[train_inds], free_raw_data=False)
fake_valid_data = lgb.Dataset(X_train.loc[fake_valid_inds], label = y_train.loc[fake_valid_inds],free_raw_data=False)
m_lgb = lgb.train(lgb_params, train_data, valid_sets = [fake_valid_data], verbose_eval=0)
t_lgb = time.time()-t0
#Fit Linear Regression
t0 = time.time()
m_linreg = LinearRegression().fit(X_train[linreg_train_cols].loc[train_inds], y_train.loc[train_inds])
t_linreg = time.time()-t0
#Fit Random Forest
t0 = time.time()
m_rf = RandomForestRegressor(n_estimators=100,max_depth=5, random_state=26, n_jobs=-1).fit(X_train.loc[train_inds], y_train.loc[train_inds])
t_rf = time.time()-t0
模型预测
值得注意的是,在训练阶段,我们使用了7 天前的 demand 数据以及 7 天前至 14 天之前的 demand 移动平均值数据作为特征数据。但是在预测阶段,是没有 demand 数据的。因此这里需要借助滑动窗口,sliding window,的概念,也就是每次计算一个预测数据。
为了计算移动平均值数据,设置滑动窗口长度为 15。
通过滑动窗口方法预测未知数据的具体代码如下:
fday = datetime(2016,3, 28)
max_lags = 15
for tdelta in range(0, 28):
    day = fday + timedelta(days=tdelta)
    tst = test[(test.date >= day - timedelta(days=max_lags)) & (test.date = fday]
Light Gradient Boosting
model_name='LightGB'
predictions[model_name] = test_final["preds_"+model_name]
#visualize
fig, ax = plt.subplots(figsize=(25,4))
train[-28:].plot(x='date',y='demand',label='Train',ax=ax)
test_final.plot(x='date',y='demand',label='Test',ax=ax);
predictions.plot(x='date',y=model_name,label=model_name,ax=ax);
#evaluate
score = np.sqrt(mean_squared_error(predictions[model_name].values, test_final['demand']))
print('RMSE for {}: {:.4f}'.format(model_name,score))
stats = stats.append({'Model Name':model_name, 'Execution Time':t_lgb, 'RMSE':score},ignore_index=True)
Light Gradient Boosting 预测结果

model_name='RandomForest'
predictions[model_name] = test_final["preds_"+model_name]
#visualize
fig, ax = plt.subplots(figsize=(25,4))
train[-28:].plot(x='date',y='demand',label='Train',ax=ax)
test_final.plot(x='date',y='demand',label='Test',ax=ax);
predictions.plot(x='date',y=model_name,label=model_name,ax=ax);
#evaluate
score = np.sqrt(mean_squared_error(predictions[model_name].values, test_final['demand']))
print('RMSE for {}: {:.4f}'.format(model_name,score))
stats = stats.append({'Model Name':model_name, 'Execution Time':t_lgb, 'RMSE':score},ignore_index=True)
Random Forest 预测结果

model_name='LinearReg'
predictions[model_name] = test_final["preds_"+model_name]
#visualize
fig, ax = plt.subplots(figsize=(25,4))
train[-28:].plot(x='date',y='demand',label='Train',ax=ax)
test_final.plot(x='date',y='demand',label='Test',ax=ax);
predictions.plot(x='date',y=model_name,label=model_name,ax=ax);
#evaluate
score = np.sqrt(mean_squared_error(predictions[model_name].values, test_final['demand']))
print('RMSE for {}: {:.4f}'.format(model_name,score))
stats = stats.append({'Model Name':model_name, 'Execution Time':t_linreg, 'RMSE':score},ignore_index=True)
Linear Regression 预测结果

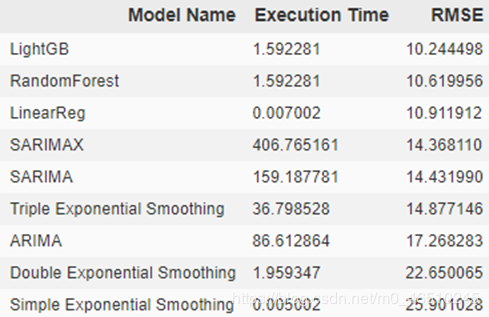
以上就是所有的预测方法及过程。各个方法的运算时间及结果误差如下:
stats.sort_values(by='RMSE')
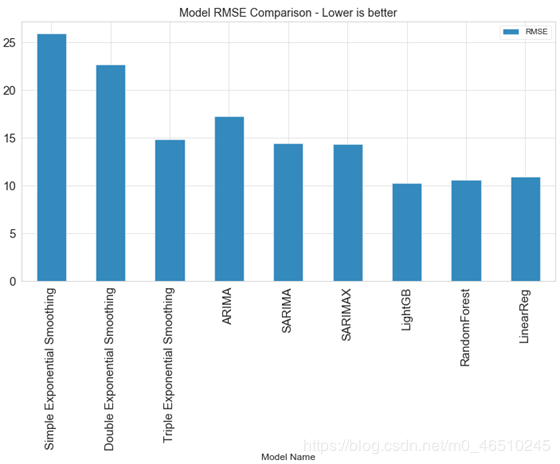
stats.plot(kind='bar',x='Model Name', y='RMSE', figsize=(12,6), title="Model RMSE Comparison - Lower is better");
各个方法的运算时间及结果误差对比

各个方法的结果误差对比

可以看出,传统预测方法的性能相较于机器学习预测方法较差。
但是这个结论并不是绝对的。方法的准确度取决于不同的问题背景。
机器学习方法依赖于特征数据。如果我们只有时间序列数据,那么特征数据较为缺乏,我们可以基于原始数据创建特征数据,如滞后数据、移动平均数据等。因此机器学习方法要呈现更好地预测结果,特征工程至关重要。在机器学习领域,某种程度上,数据才是起决定作用,而不是模型或者算法。
最后,参加过这个比赛的应该都能看到我们的公众号

作者:deephub