python实现基金定投并可视化结果(及时止损)
1.什么是指数基金
2.什么是基金定投
3.本次数据来源
4.作出假设
5.改变定投策略,获得更好的收益(以2018和2019的平均收益率分析)
改变定投周期(三月一次定投) 改变定投金额(设置投入资金固定比例) 及时止损(资金最大时收盘) 1.什么是指数基金股票指数是指按照一定的规则所选择的股票的平均值。比如:
上证50指数:就是把上海证券交易所规模最大、流动性最好的50家公司的股票统计起来的股票平均值。
沪深300指数:就是把上交所和深交所前300只规模最大、流动最好的300家公司的股票统计起来的股票平均值。
中证500指数:把沪深300指数的前300家大公司排除,剩下的大公司中再选前500只规模最大、流动最好的500家公司的股票统计起来的股票平均值。
因此:指数基金即按照某选股规则选出来的一堆股票的集合即指数基金
2.什么是基金定投基金定投,就是按照固定的频率和固定的金额,不停分批次小额买入金融市场上的基金。定投可以选择任何种类的基金。我们以指数基金为例(大部分传说中无脑定投的案例都是以指数基金的定投方式),分析本案例
3.本次数据来源通过API接口从网易财经上进行调取
接口规范
http://quotes.money.163.com/service/chddata.html?code=003833&start=19901219&end=20200228&fields=TCLOSE;HIGH;LOW;TOPEN;LCLOSE;CHG;PCHG;VOTURNOVER;VATURNOVER
说明:
code参数后面的7位整数代表了股票代码;比如0000001指的是上证指数。注意这串数字要分0和000001两部分看。0代表sh,1代表sz。所以0000001其实是sh000001的意思。同理,0 000300也就是sh000300 沪深300的代码。
start和end参数后面的8位整数代表年(xxxx)月(xx)日(xx)
fields选项中,TCLOSE,HIGH,LOW,TOPEN分别表示当日的收盘,最高,最低,开盘价;LCLOSE表示昨日收盘>价。CHG,PCHG,VOTURNOVER,VAT分别表示涨跌额,涨跌幅,成交量,成交金额。
本次研究沪深300指数基金
4.作出假设# 加载模块
from datetime import datetime,timedelta
import numpy as np
import pandas as pd
import matplotlib.pyplot as plt
%matplotlib inline
# 指定默认字体
plt.rcParams['font.family']=['SimHei']
# 解决负号'-'显示为方块的问题
plt.rcParams['axes.unicode_minus']=False
# 获取数据
def get_data(indexID,dateStart="20000101",dateEnd="20200320",local=True):
    # 定义网络数据接口
    api="http://quotes.money.163.com/service/chddata.html?code="
    if local:
        data=pd.read_csv(indexID[1:]+'.csv',index_col=0,encoding='gb2312')  # index_col将第一列作为index使用,'gb2312'文件里有中文
    else:
        api+=indexID+"&start="+dateStart+"&end="+dateEnd
        api+="&fields=TCLOSE;HIGH;LOW;TOPEN;LCLOSE;CHG;PCHG;VOTURNOVER;VATURNOVER"
        data=pd.read_csv(api,index_col=0,encoding='gb2312')
    data=data.loc[(data.index>datetime.strptime(dateStart,"%Y%m%d").strftime("%Y-%d-%m"))
                  &(data.index<datetime.strptime(dateEnd,"%Y%m%d").strftime("%Y-%d-%m"))]
    data=data.sort_values(by=['日期']) #排序
    return data
def invest(indexID,dateStart,dateEnd,amount,freq,fixRate=None,fixPercent=0.15,strategy=1):
    '''
    简单定投的实现
    strategy-定投策略:
        1-固定金额(amount)
        2-固定比例(fixPercent)
        3-给定最小投入额情况下的固定比例(max(fixPercent,amount))
        4-逢低加大买入
    fixRate-定期存款的年利率:用于计算收益对比
    '''
    # 获取数据
    data=get_data(indexID,dateStart,dateEnd,False)
    # 初始化定投金额/份额列表/定投日期
    listAmount=[]
    listShare=[]
    listDate=[]
    # 定投比例
    percent=fixPercent
    # 定投次数
    num=0
    # 固定收益
    fixProfit=0
    # 开始定投
    st=datetime.strptime(dateStart,"%Y%m%d")
    sd=datetime.strptime(dateEnd,"%Y%m%d")
    while True:
        if st.strftime("%Y-%m-%d") not in data.index:
            st+=timedelta(days=1)
        else:
            #投入金额
            price=data.loc[st.strftime("%Y-%m-%d")]['收盘价']
            listDate.append(st)
            if strategy==1:
                listAmount.append(amount)
            elif strategy==2:
                listAmount.append(price*percent)
            else:
                listAmount.append(max(price*percent,amount))
            share=listAmount[-1]/price
            listShare.append(share)
            #定投周期
            st+=timedelta(days=freq)
            # 固定收益更新
            fixProfit+=(1+fixRate)**((sd-listDate[-1]).days/365)*listAmount[-1]
            num+=1
        if st>sd:
            break
    # 计算定投收益
    totalInvest=sum(listAmount)
    totalProfit=sum(listShare)*price-totalInvest
    # 计算固定利率收益
    fixProfit=fixProfit-totalInvest
    return totalInvest,totalProfit,fixProfit
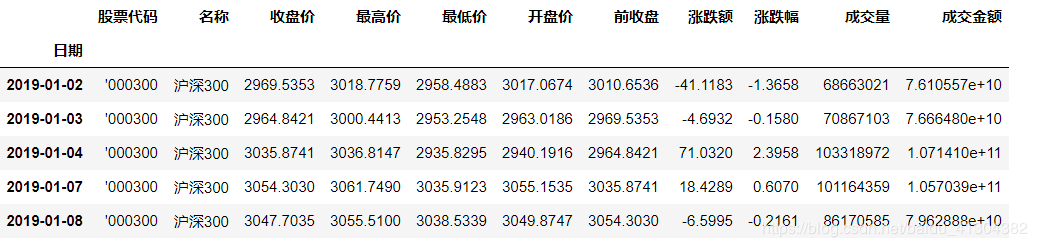
每周定投一次,每次定投500,计算2019年对沪深300指数基金进行定投的收益率
# 数据参数
indexID='0000300' #沪深300
dateStart='20190101' #开始日期
dateEnd='20191231'	#结束日期
# 固定年利率  作为收益对比
fixRate=0.03
# 定投参数
amount=500 # 每期定投金额(单位:元)
freq=7 # 定投周期(单位:天)
# 数据获取
data=get_data(indexID,dateStart,dateEnd,False)
data.head()
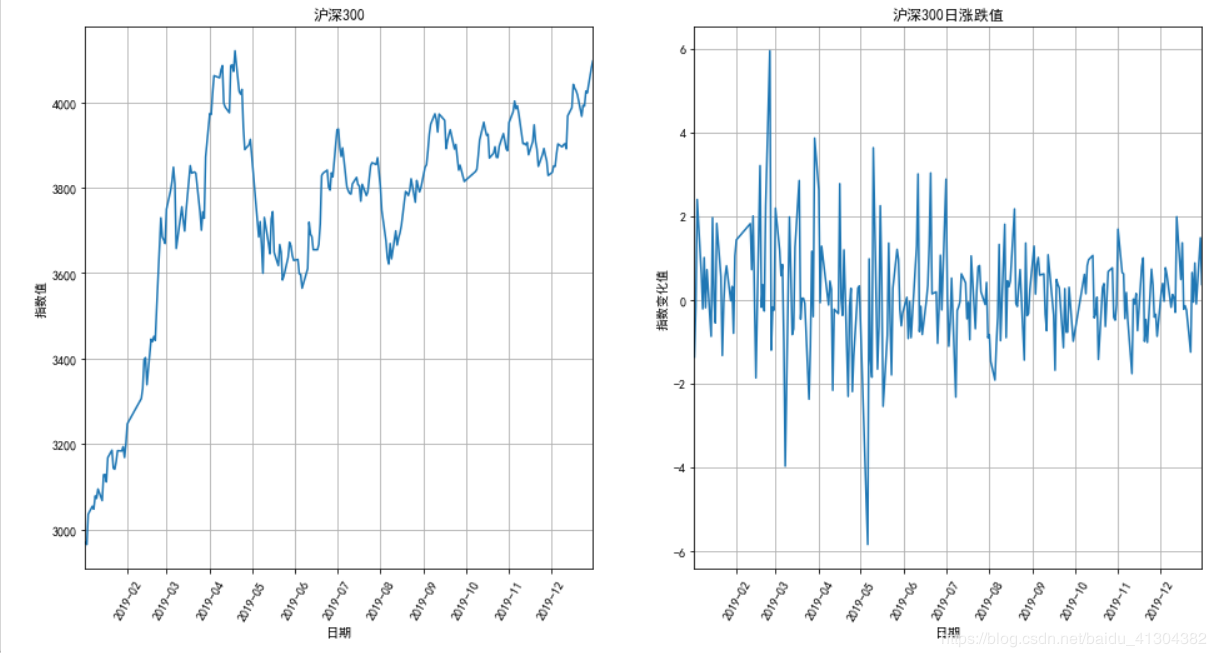
# 数据可视化
'''
str转换为datetime  通过datetime.strptime()
datetime对象 转换为str 通过datetime.strftime()
'''
xs=[datetime.strptime(d,'%Y-%m-%d').date() for d in data.index]
plt.figure(figsize=(16,8))
plt.subplot(121)
plt.plot(xs,data["收盘价"])
plt.xlim([xs[0],xs[-1]])
plt.xticks(rotation=60)
plt.xlabel("日期")
plt.ylabel("指数值")
plt.title(data["名称"][0])
plt.grid()
plt.subplot(122)
plt.plot(xs,pd.to_numeric(data['涨跌幅'],errors='coerce'))
plt.xlim(xs[0],xs[-1])
plt.xticks(rotation=60)
plt.xlabel("日期")
plt.ylabel("指数变化值")
plt.title(data['名称'][0]+"日涨跌值")
plt.grid()
totalInvest,totalProfit,fixProfit=invest(indexID,dateStart,dateEnd,amount,freq,fixRate=fixRate,fixPercent=0.15,strategy=1)
print("定投总投入为%10.2f元,获得收益%10.2f元,固定年利率收益为%10.2f元"%(totalInvest,totalProfit,fixProfit))
print("定投收益率{:6.2f}%".format(totalProfit/totalInvest*100))
'''
输出结果:
定投总投入为  26000.00元,获得收益   2531.34元,固定年利率收益为    382.18元
定投收益率  9.74%
'''
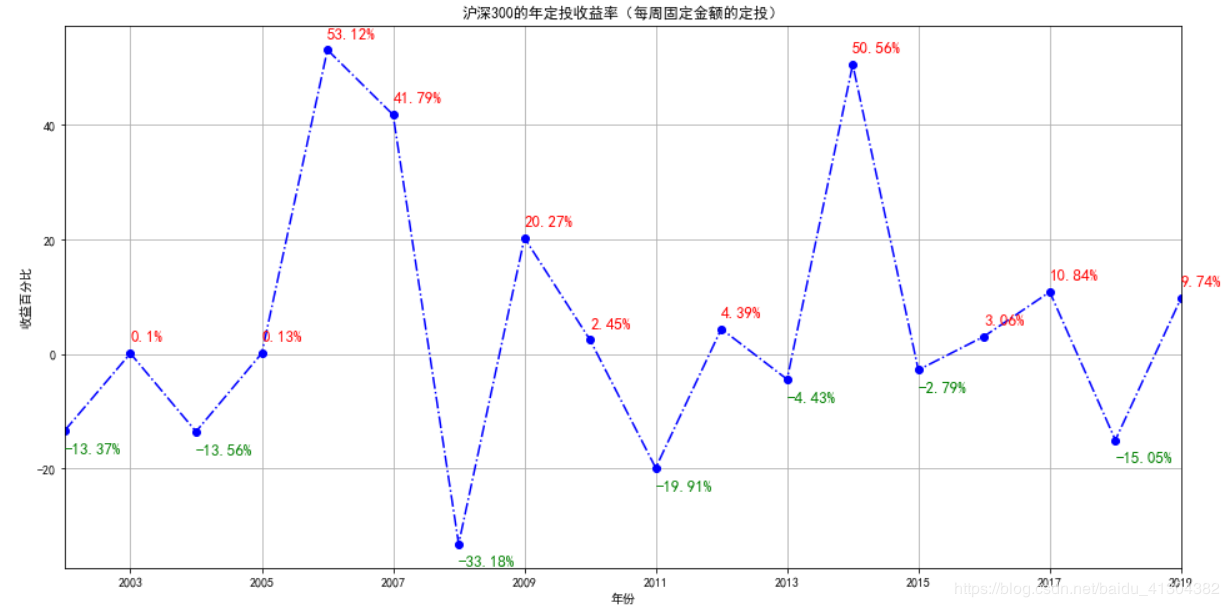
每周定投一次,每次定投500,分别计算从2002年开始到2019年,每年定投沪深300指数基金的收益率
# 数据参数
indexID="0000300"
firstYear=2002
nYears=18
#固定年利率-收益对比
fixRate=0.03
# 定投参数
amount=500  # 每期定投金额
freq=7     # 定投周期(单位:天)
# 定投收益
profits=[]
# 遍历年份
for year in range(nYears):
    thisYear=str(firstYear+year)
    dateStart=thisYear+"0101"
    dateEnd=thisYear+"1231"
    totalInvest,totalProfit,fixProfit=invest(indexID,dateStart,dateEnd,amount,freq,fixRate=fixRate,fixPercent=0.15,strategy=1)
    profits.append(totalProfit/totalInvest*100)
    print("{}年的定投收益率{:6.2f}%".format(thisYear,totalProfit/totalInvest*100))
'''
输出结果:
2002年的定投收益率-13.37%
2003年的定投收益率  0.10%
2004年的定投收益率-13.56%
2005年的定投收益率  0.13%
2006年的定投收益率 53.12%
2007年的定投收益率 41.79%
2008年的定投收益率-33.18%
2009年的定投收益率 20.27%
2010年的定投收益率  2.45%
2011年的定投收益率-19.91%
2012年的定投收益率  4.39%
2013年的定投收益率 -4.43%
2014年的定投收益率 50.56%
2015年的定投收益率 -2.79%
2016年的定投收益率  3.06%
2017年的定投收益率 10.84%
2018年的定投收益率-15.05%
2019年的定投收益率  9.74%
'''
# 可视化定投结果
xs=[datetime.strptime(str(d),'%Y').date() for d in range(2002,2020)]
plt.figure(figsize=(16,8))
plt.plot(xs,profits,'bo-.')
plt.xlim(xs[0],xs[-1])
plt.xlabel("年份")
plt.ylabel("收益百分比")
plt.title("沪深300的年定投收益率(每周固定金额的定投)")
plt.grid()
for i in range(len(profits)):
    if profits[i]>0:
        plt.text(xs[i],profits[i]+2,str(round(profits[i],2))+"%",color='r',fontsize=13)
    else:
        plt.text(xs[i],profits[i]-4,str(round(profits[i],2))+"%",color='g',fontsize=13)
# 数据参数
indexID="0000300"
firstYear=2002
nYears=18
#固定年利率-收益对比
fixRate=0.03
# 定投参数
amount=500  # 每期定投金额
freq=7     # 定投周期(单位:天)
# 定投收益
quarterly_profits=[]
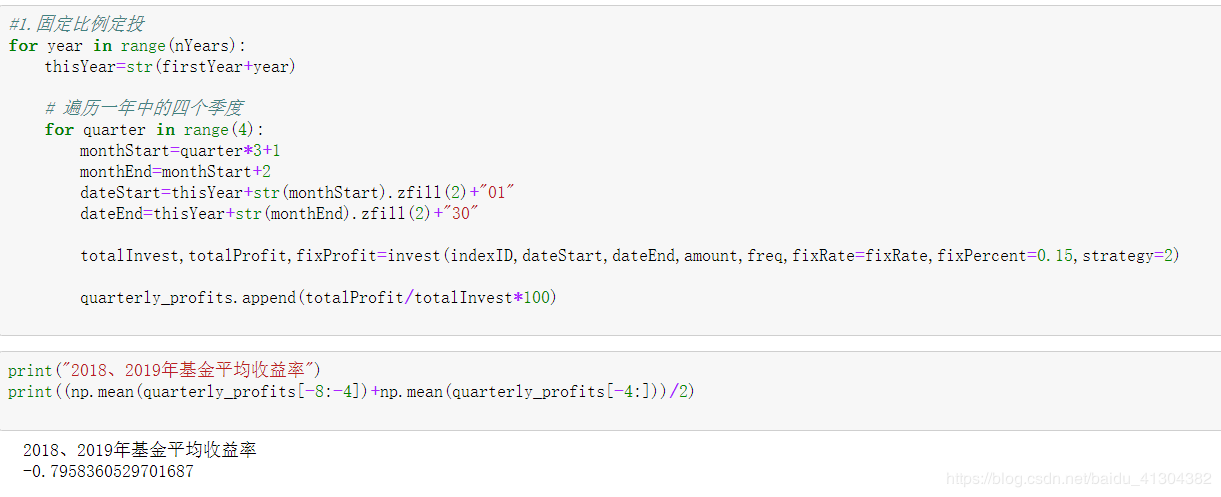
改变定投周期(每三个月定投)
for year in range(nYears):
    thisYear=str(firstYear+year)
    # 遍历一年中的四个季度
    for quarter in range(4):
        monthStart=quarter*3+1
        monthEnd=monthStart+2
        dateStart=thisYear+str(monthStart).zfill(2)+"01"
        dateEnd=thisYear+str(monthEnd).zfill(2)+"30"
        totalInvest,totalProfit,fixProfit=invest(indexID,dateStart,dateEnd,amount,freq,fixRate=fixRate,fixPercent=0.15,strategy=1)
        quarterly_profits.append(totalProfit/totalInvest*100)
# 可视化定投结果
xs=[datetime.strptime(str(d)+str(m).zfill(2),'%Y%m').date() for d in range(2002,2020) for m in range(1,12,3)]
plt.figure(figsize=(16,8))
plt.plot(xs,quarterly_profits,'bo-.')
plt.xlim(xs[0],xs[-1])
plt.xlabel("年份")
plt.ylabel("收益百分比")
plt.title("沪深300的年定投收益率(每周固定金额的定投)")
plt.grid()
for i in range(len(quarterly_profits)):
    if quarterly_profits[i]>0:
        plt.text(xs[i],quarterly_profits[i]+1,str(round(quarterly_profits[i],2))+"%",color='r',fontsize=13)
    else:
        plt.text(xs[i],quarterly_profits[i]-2,str(round(quarterly_profits[i],2))+"%",color='g',fontsize=13)
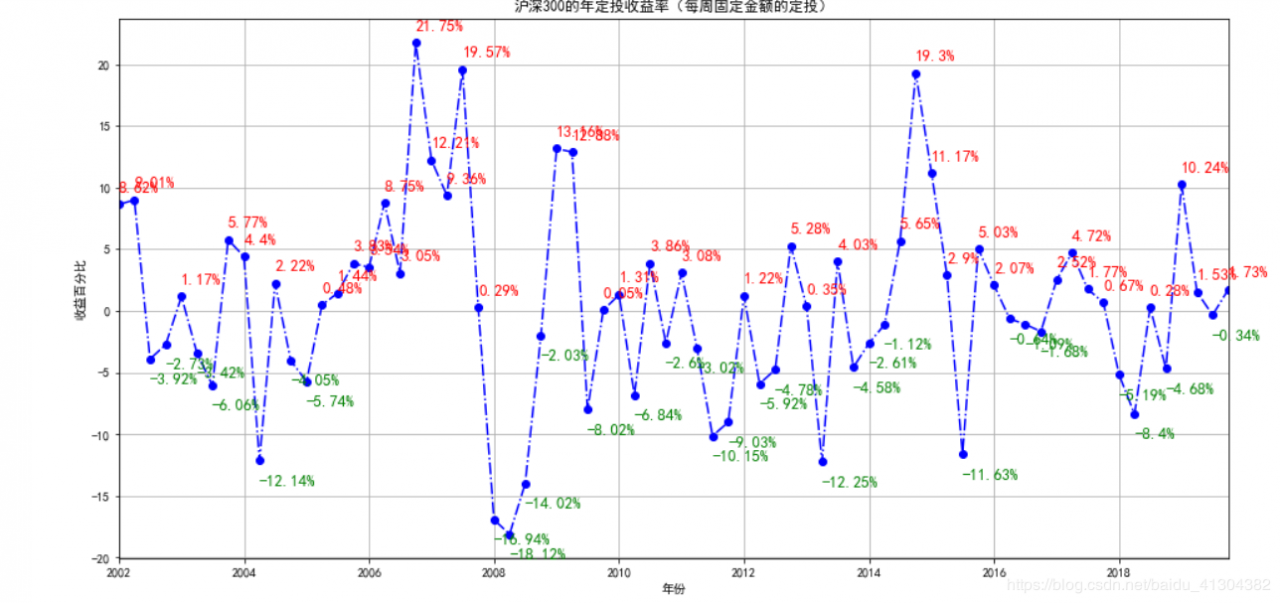
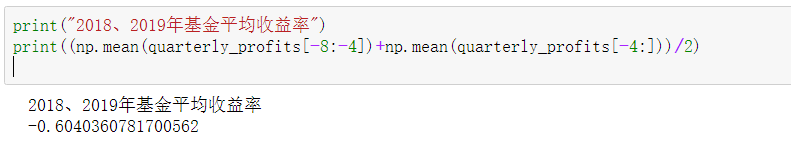
2018、2019平均收益率如下:
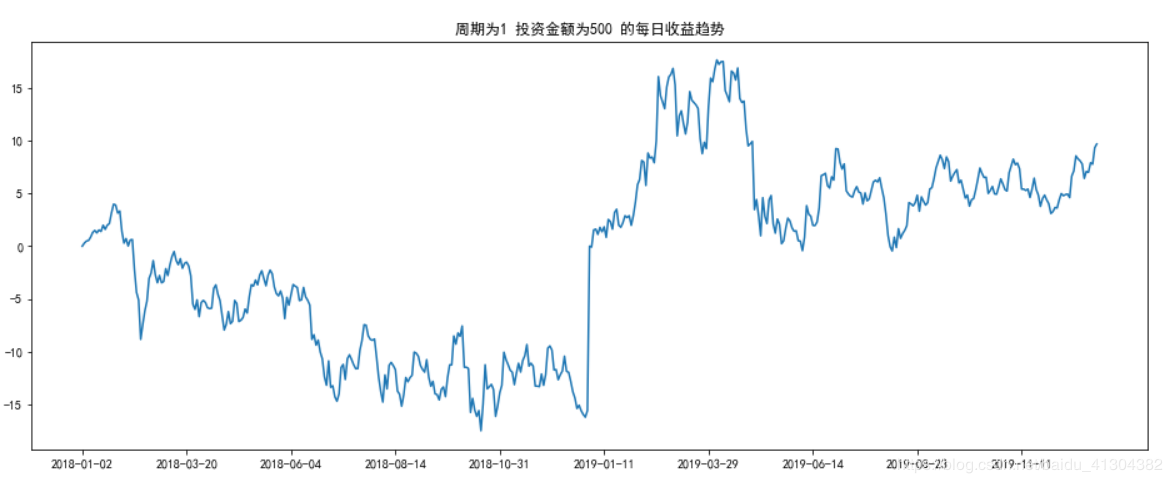
为了更加细致地得到最大定投收益,我们将定投周期改为日,只定投18、19年,其他不变,找出最大收益的日期为截至定投日期,并计算截至日期之前的平均收益率
这种方法,是基于知道了每日的收盘价,然后计算每天的收益率,当是一年的最大值时就停止定投,类似于”上帝视角“。
def invest(df,invest_cycle,invest_amount):
    '''
    返回每次投资的收益率
    invest_cycle:定投周期
    invest_amount:定投金额
    '''
    data=df['收盘价']
    time=list(df.index.values)
    time.append("2020")
    rate_dic={}  #记录 每一次的定投的收益率
    total_invest=0
    total_invest_dic={}
    share=0
    for i in range(len(data)):   # len(data)=len(time)+1
        if time[i][:4]==time[i+1][:4]:
            if i%invest_cycle==0: # 符合定投日期
                share=share+invest_amount/data[i] #买入
                total_invest=total_invest+invest_amount # 记录定投时的总投资
                total_invest_dic[time[i][:4]]=total_invest     # 记录每次定投的投资
                rate_dic[time[i]]=(share*data[i]/total_invest-1)*100    #每次定投时的收益率
        else: # 一年的最后一天
            if i%invest_cycle==0: # 符合定投日期
                share=share+invest_amount/data[i] #买入
                total_invest=total_invest+invest_amount # 记录定投时的总投资
                total_invest_dic[time[i][:4]]=total_invest     # 记录每次定投的投资
                rate_dic[time[i]]=(share*data[i]/total_invest-1)*100    #每次定投时的收益率
            share=0   #计算下一年清零
            total_invest=0
    return rate_dic
def date_close(result):
    '''
    返回最大投资的日期
    策略:反向搜索
    计算每日的定投收益率-->确定最大收益的投资截至的日期
    '''
    dic_18={}  # 记录2018年的定投日期及收益率
    dic_19={}
    key=result.keys()  # 记录定投的日期
    value=result.values()  # 记录定投的收益率
    for i in range(len(list(key))):
        if list(key)[i][:4]=='2018':
            dic_18[i]=list(value)[i]
        else:
            dic_19[i]=list(value)[i]
    max1=max(dic_18.values())
    id=list(dic_18.keys())[list(dic_18.values()).index(max(dic_18.values()))]  # 最大值的id
    date_close1=list(key)[id]
    max2=max(dic_19.values())
    id=list(dic_19.keys())[list(dic_19.values()).index(max(dic_19.values()))]  # 最大值的id
    date_close2=list(key)[id]
    return [max1,max2,date_close1,date_close2]
#当 周期为1
data_1819=get_data(indexID,'20180101','20191231',False)
result=invest(data_1819,1,500)
plt.figure(figsize=(16,6))
plt.title("周期为1 投资金额为500 的每日收益趋势")
plt.xticks([0,50,100,150,200,250,300,350,400,450])
plt.plot(result.keys(),result.values())
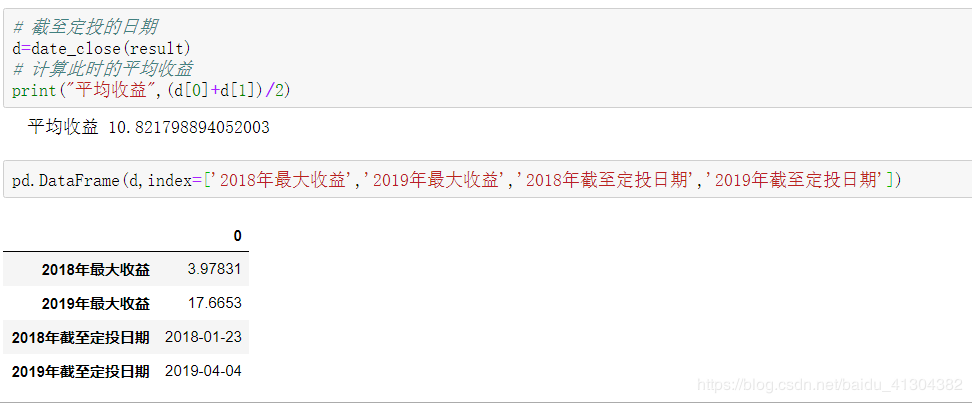
# 截至定投的日期
d=date_close(result)
# 计算此时的平均收益
print("平均收益",(d[0]+d[1])/2)
作者:Tris_二小姐