Python利用Seaborn绘制多标签的混淆矩阵
Seaborn - 绘制多标签的混淆矩阵、召回、精准、F1
导入seaborn\matplotlib\scipy\sklearn等包:
import seaborn as sns
from matplotlib import pyplot as plt
from scipy.special import softmax
from sklearn.metrics import accuracy_score, confusion_matrix, precision_score, recall_score, f1_score
sns.set_theme(color_codes=True)
从dataframe中,获取y_true(真实标签)和y_pred(预测标签):
y_true = df["target"]
y_pred = df['prediction']
计算验证数据整体的准确率acc、精准率precision、召回率recall、F1,使用加权模式average=‘weighted’:
# 准确率acc,精准precision,召回recall,F1
acc = accuracy_score(df["target"], df['prediction'])
precision = precision_score(y_true, y_pred, average='weighted')
recall = recall_score(y_true, y_pred, average='weighted')
f1 = f1_score(y_true, y_pred, average='weighted')
print(f'[Info] acc: {acc}, precision: {precision}, recall: {recall}, f1: {f1}')
计算混淆矩阵:
# 横坐标是真实类别数,纵坐标是预测类别数
cf_matrix = confusion_matrix(y_true, y_pred)
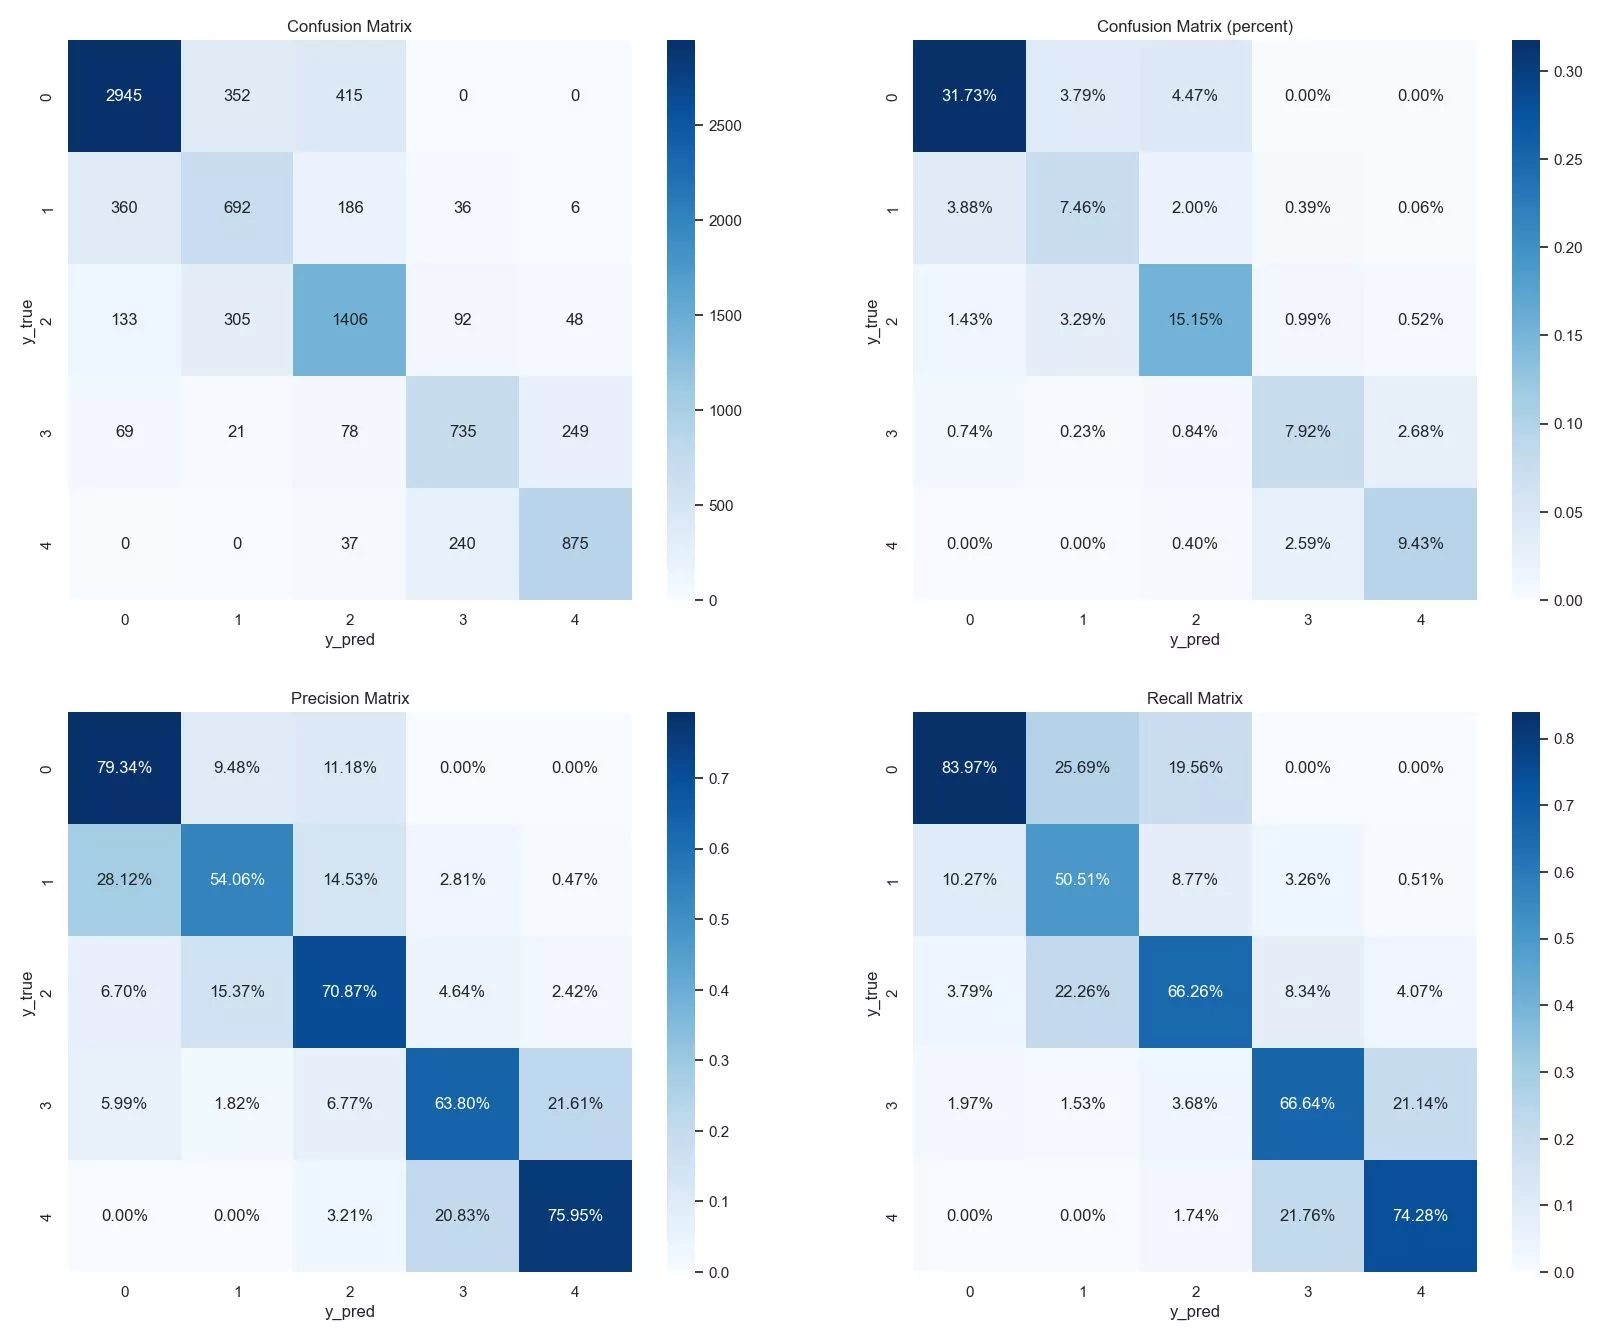
5类矩阵的绘制方案,混淆矩阵、百分比的混淆矩阵、召回矩阵、精准矩阵、F1矩阵:
混淆矩阵是计数,百分比的混淆矩阵是占比
召回矩阵是,每行的和是1,每行代表真实类别数,占比就是召回
精准矩阵是,每列的和是1,每列代表预测列表数,占比就是精准
F1矩阵是按照 2PR/(P+R),注意为0的情况,需要补0,使用np.divide(a, b, out=np.zeros_like(a), where=(b != 0))
代码如下:
# 横坐标是真实类别数,纵坐标是预测类别数
cf_matrix = confusion_matrix(y_true, y_pred)
figure, axes = plt.subplots(2, 2, figsize=(16*1.25, 16))
# 混淆矩阵
ax = sns.heatmap(cf_matrix, annot=True, fmt='g', ax=axes[0][0], cmap='Blues')
ax.title.set_text("Confusion Matrix")
ax.set_xlabel("y_pred")
ax.set_ylabel("y_true")
# plt.savefig(csv_path.replace(".csv", "_cf_matrix.png"))
# plt.show()
# 混淆矩阵 - 百分比
cf_matrix = confusion_matrix(y_true, y_pred)
ax = sns.heatmap(cf_matrix / np.sum(cf_matrix), annot=True, ax=axes[0][1], fmt='.2%', cmap='Blues')
ax.title.set_text("Confusion Matrix (percent)")
ax.set_xlabel("y_pred")
ax.set_ylabel("y_true")
# plt.savefig(csv_path.replace(".csv", "_cf_matrix_p.png"))
# plt.show()
# 召回矩阵,行和为1
sum_true = np.expand_dims(np.sum(cf_matrix, axis=1), axis=1)
precision_matrix = cf_matrix / sum_true
ax = sns.heatmap(precision_matrix, annot=True, fmt='.2%', ax=axes[1][0], cmap='Blues')
ax.title.set_text("Precision Matrix")
ax.set_xlabel("y_pred")
ax.set_ylabel("y_true")
# plt.savefig(csv_path.replace(".csv", "_recall.png"))
# plt.show()
# 精准矩阵,列和为1
sum_pred = np.expand_dims(np.sum(cf_matrix, axis=0), axis=0)
recall_matrix = cf_matrix / sum_pred
ax = sns.heatmap(recall_matrix, annot=True, fmt='.2%', ax=axes[1][1], cmap='Blues')
ax.title.set_text("Recall Matrix")
ax.set_xlabel("y_pred")
ax.set_ylabel("y_true")
# plt.savefig(csv_path.replace(".csv", "_precision.png"))
# plt.show()
# 绘制4张图
plt.autoscale(enable=False)
plt.savefig(csv_path.replace(".csv", "_all.png"), bbox_inches='tight', pad_inches=0.2)
plt.show()
# F1矩阵
a = 2 * precision_matrix * recall_matrix
b = precision_matrix + recall_matrix
f1_matrix = np.divide(a, b, out=np.zeros_like(a), where=(b != 0))
ax = sns.heatmap(f1_matrix, annot=True, fmt='.2%', cmap='Blues')
ax.title.set_text("F1 Matrix")
ax.set_xlabel("y_pred")
ax.set_ylabel("y_true")
plt.savefig(csv_path.replace(".csv", "_f1.png"))
plt.show()
输出混淆矩阵、混淆矩阵(百分比)、召回矩阵、精准矩阵:
F1 Score:

到此这篇关于Python利用Seaborn绘制多标签的混淆矩阵的文章就介绍到这了,更多相关Python Seaborn混淆矩阵内容请搜索软件开发网以前的文章或继续浏览下面的相关文章希望大家以后多多支持软件开发网!