python3数学建模基础(四)多个函数图像求交点
python3数学建模基础(四)多个函数图像求交点
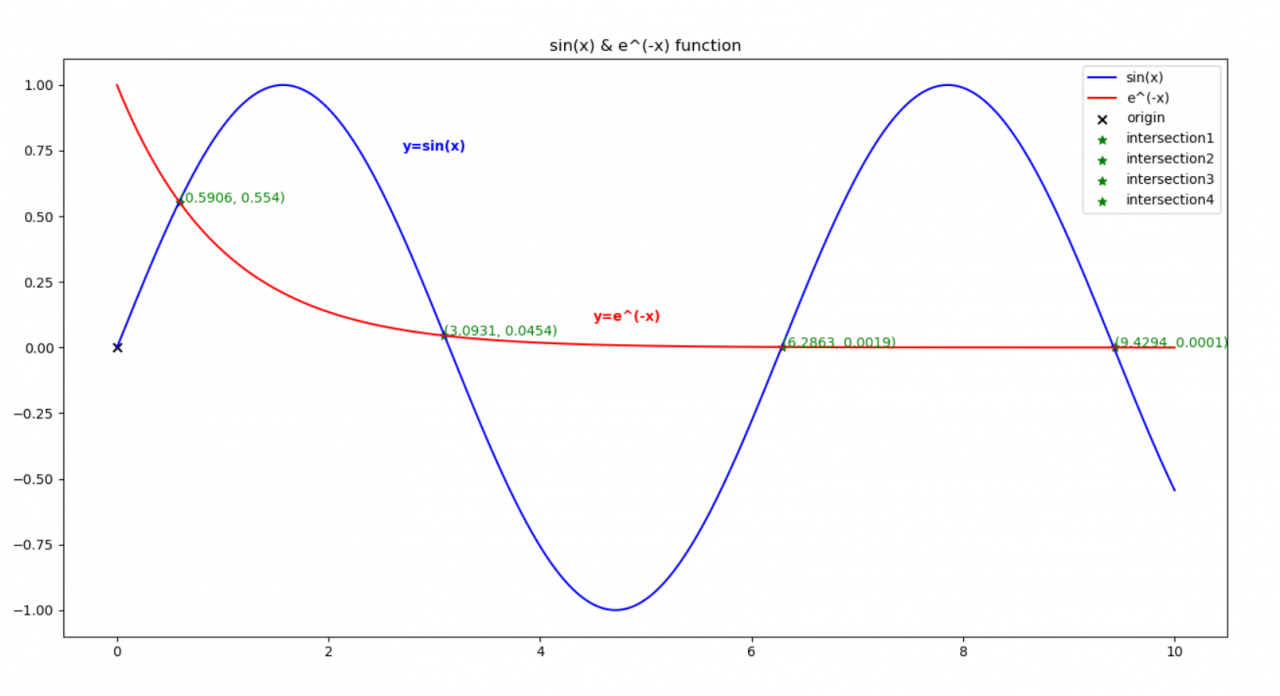
本文以sin(x)和e^(-x)为例,用python3实现数学建模中多个函数求交点
#作者
#生姜用户
import numpy as np
import math
from matplotlib import pyplot as plt
x1=[]
y1=[]
x2=[]
y2=[]
a=np.linspace(0,10,1000)
def line1(x1):
y1=math.sin(x1)
return y1
def line2(x2):
y2=math.exp(-x2)
return y2
def f3(k):
y3=math.sin(k)
return y3
def f4(k):
y4=math.exp(-k)
return y4
plt.figure("sin(x) & e^(-x) function")
for i in a:
x1.append(i)
y1.append(line1(i))
x2.append(i)
y2.append(line2(i))
x_position=0
y_position=0
plt.scatter(x_position,y_position , marker = 'x',color = 'black', s = 40 ,label = 'origin')
j=0
for k in a:
y5=f3(k)-f4(k)
if math.fabs(y5)<0.005:
j=j+1
plt.scatter(k ,f4(k) , marker = '*',color = 'green', s = 40 ,label = 'intersection'+str(j))
plt.text(k ,f4(k) ,(round(k,4),round(f4(k),4)),color='green')
plt.text(2.7,0.75, "y=sin(x)", weight="bold", color="blue")
plt.plot(x1, y1, color='blue', label="sin(x)")
plt.text(4.5,0.1, "y=e^(-x)", weight="bold", color="red")
plt.plot(x2, y2, color='red', label="e^(-x)")
plt.title("sin(x) & e^(-x) function")
plt.legend()
plt.show()
作者:生姜用户