Golang pprof性能测试与分析讲解
一、性能分析类型
1.CPU性能分析
2.内存性能分析
3.阻塞性能分析
二、cpu性能分析
1.生成pporf
2.分析数据
三、内存性能分析
四、benchmark 生成 profile
一、性能分析类型 1.CPU性能分析CPU性能分析是最常见的性能分析类型。启动CPU分析时,运行时每隔10ms中断一次,采集正在运行协程的堆栈信息。
程序运行结束后,可以根据收集的数据,找到最热代码路径。
一个函数在分析阶段出现的次数越多,则该函数的代码路径(code path)花费的时间占总运行时间的比重越大。
2.内存性能分析内存性能分析记录堆内存分配信息,忽略栈内存的分配。
内存分析启动时,默认每1000次采样1次,这个比例是可以调整的。因为内存性能分析是基于采样的,因此基于内存分析数据来判断程序所有的内存使用情况是很困难的。
3.阻塞性能分析阻塞性能分析是go特点的。
阻塞性能分析用来记录一个协程用来等待共享资源所花费的时间,这用来判断程序并发瓶颈是很有用。阻塞的场景包括:
在没有缓冲的信道上发送或接受数据。
在空的信道上接受数据或在满的信道上发送数据。
尝试获取一个已被其他协程占用的排他锁。
一般情况下,当所有的 CPU 和内存瓶颈解决后,才会考虑这一类分析。
二、cpu性能分析 1.生成pporfgo 性能分析接口位于runtime/pprof 中:
测试代码:生成5组数据,进行冒泡排序:
main.go
// main.go
package main
import (
"math/rand"
"time"
)
func generate(n int) []int {
rand.Seed(time.Now().UnixNano())
nums := make([]int, 0)
for i := 0; i < n; i++ {
nums = append(nums, rand.Int())
}
return nums
}
func bubbleSort(nums []int) {
for i := 0; i < len(nums); i++ {
for j := 1; j < len(nums)-i; j++ {
if nums[j] < nums[j-1] {
nums[j], nums[j-1] = nums[j-1], nums[j]
}
}
}
}
func main() {
n := 10
for i := 0; i < 5; i++ {
nums := generate(n)
bubbleSort(nums)
n *= 10
}
}
想要度量这段代码的性能,只需要在main函数最前加两行代码:
main()
import (
"math/rand"
"os"
"runtime/pprof"
"time"
)
func main() {
pprof.StartCPUProfile(os.Stdout)
defer pprof.StopCPUProfile()
n := 10
for i := 0; i < 5; i++ {
nums := generate(n)
bubbleSort(nums)
n *= 10
}
}
go run main.go > cpu.pprof
当然也可以将输出直接导入到文件中:
2.分析数据此时得到cpu.pprof 文件:
go tool pprof -http=:9999 cpu.pprof 如果提升Graphviz没有安装: apt installgraphviz (ubuntu)
访问localhost:9999 得到:
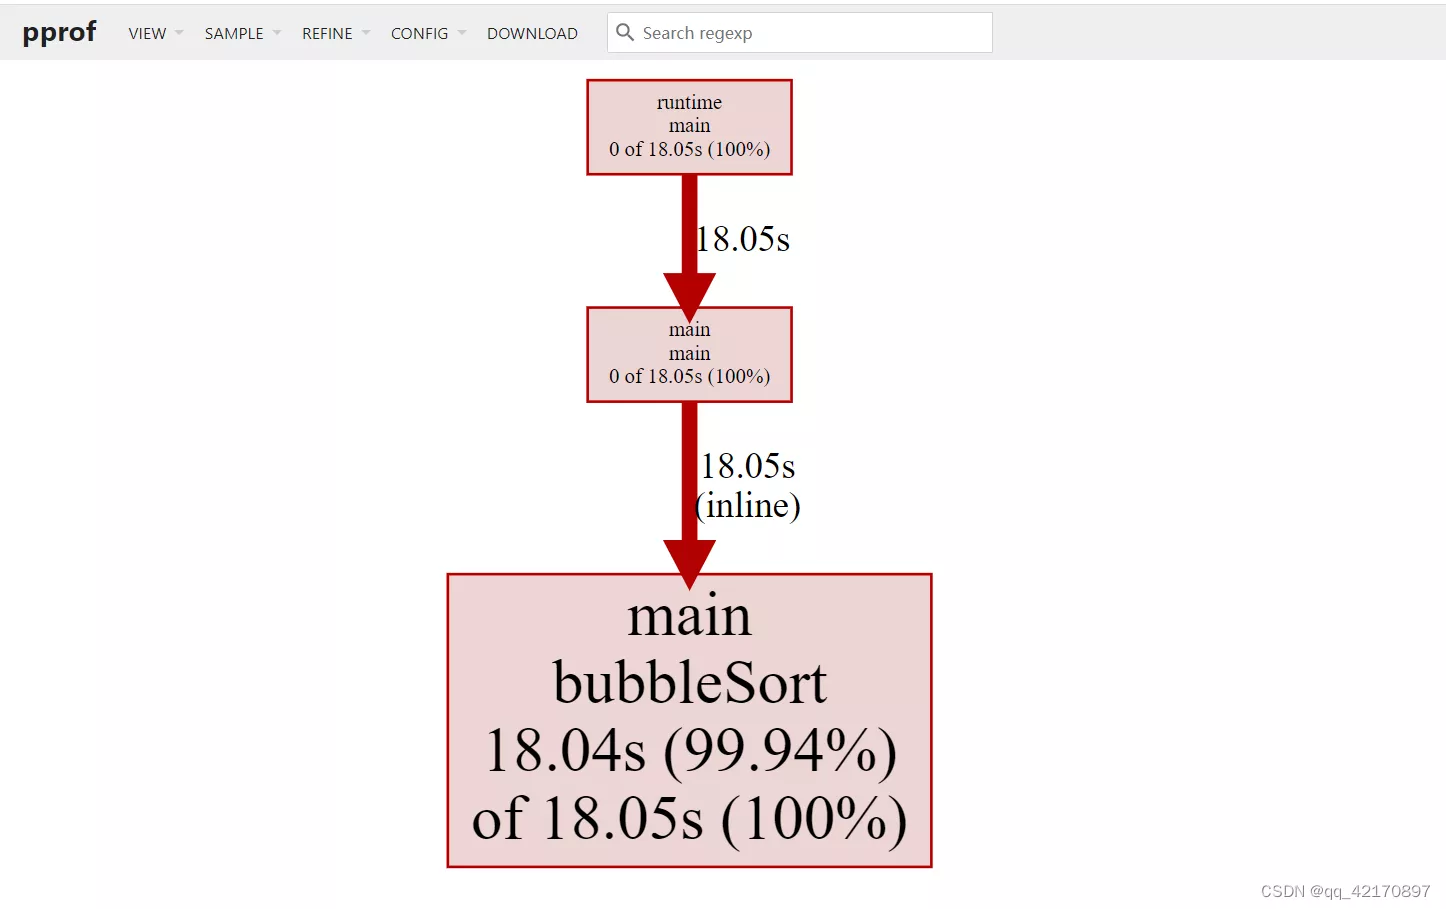
除了在网页中查看外,还可以使用交互式命令进行查看:
go tool pprof cpu.pprof
使用top 查看到 bubbleSort函数占用cpu最多。

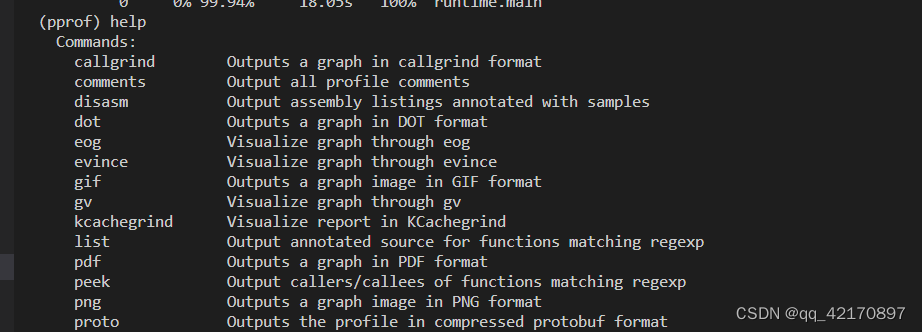
还可以使用top --cum,按照cum(累计消耗)排序:

使用help 查看帮助:
下面为一段字符串拼接代码,我们对它进行内存分析:
package main
import (
"math/rand"
"github.com/pkg/profile"
)
const letterBytes = "abcdefghijklmnopqrstuvwxyzABCDEFGHIJKLMNOPQRSTUVWXYZ"
func randomString(n int) string {
b := make([]byte, n)
for i := range b {
b[i] = letterBytes[rand.Intn(len(letterBytes))]
}
return string(b)
}
func concat(n int) string {
s := ""
for i := 0; i < n; i++ {
s += randomString(n)
}
return s
}
func main() {
concat(100)
}
我们使用另外一个性能分析库"github.com/pkg/profile" 它内部封装了 runtime/pprof 接口,使用起来更加简单。
cpu性能分析:
defer profile.Start().Stop()
内存性能分析:
defer profile.Start(profile.MemProfile, profile.MemProfileRate(1)).Stop()
profile包会自动在/tmp目录下生成profile文件
go tool pprof -http=:9999 /tmp/profile575547387/mem.pprof
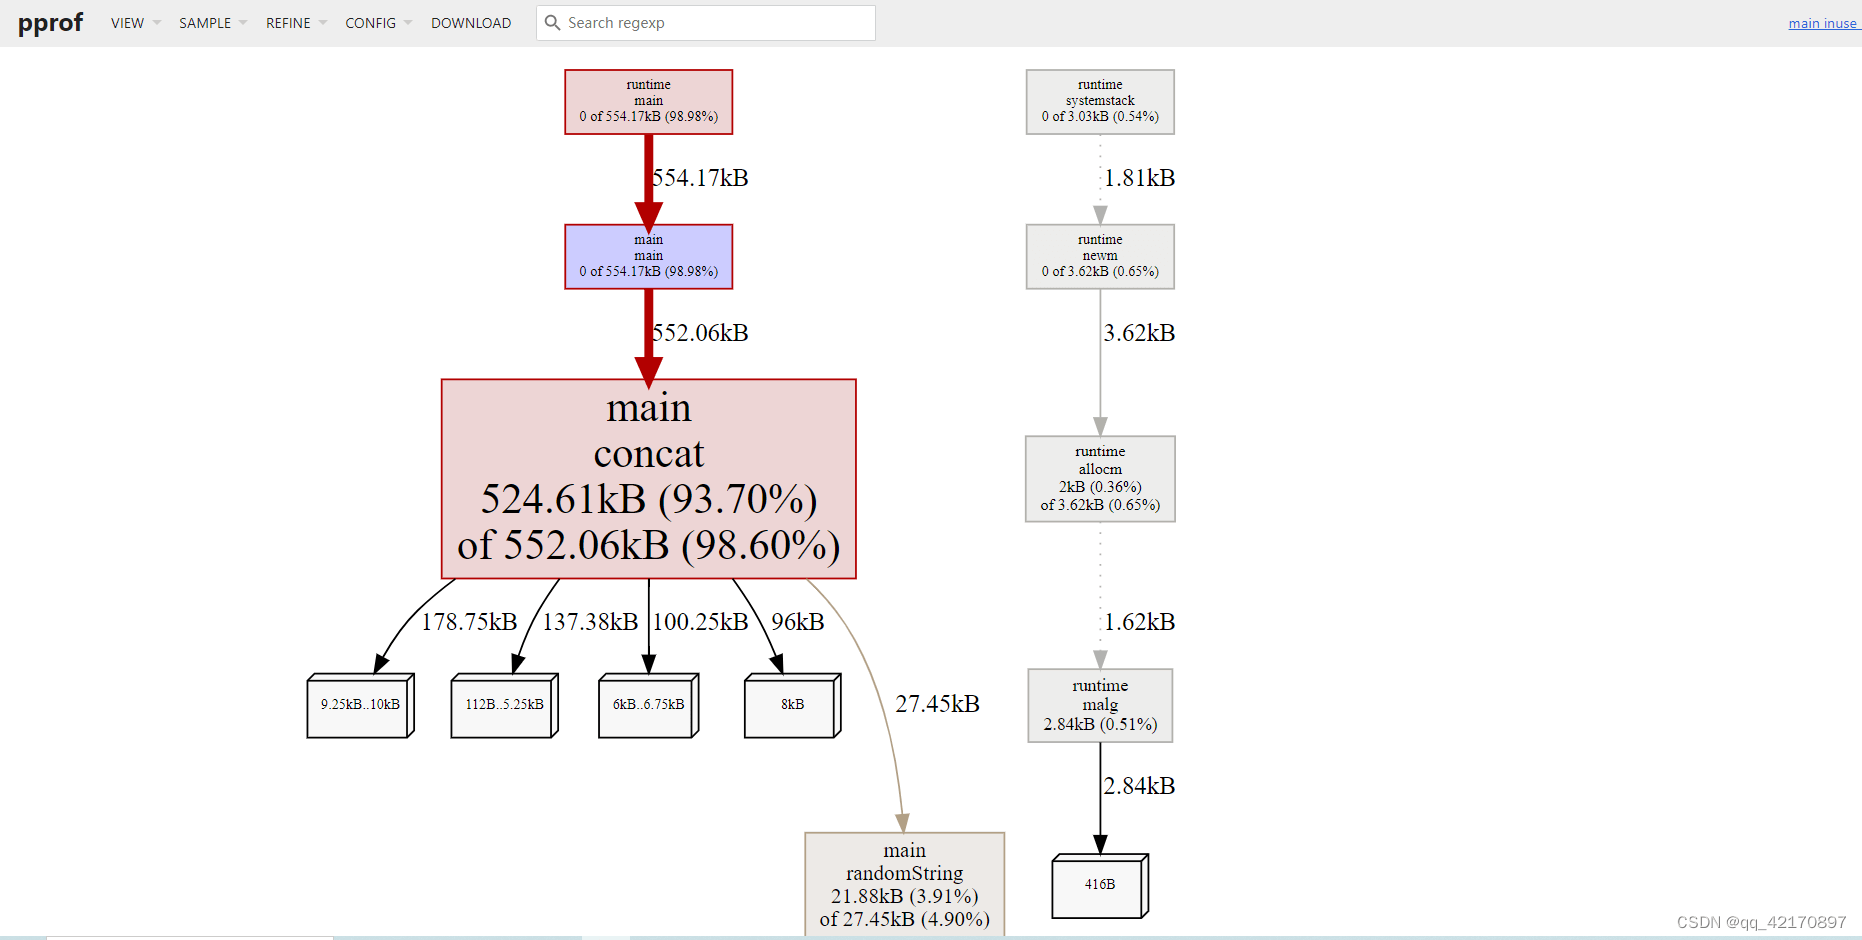
可以看见concat 消耗了 524 KB, 而randomString消耗了 21KB,为什么相差这么大呢?
因为go中的字符串不可修改,使用+ 连接字符串会导致重新生成新的字符串,将 + 两边的子字符串拷贝到新的字符串去。那这种设计多次字符串拼接的场景该如何优化呢?使用strings.Builder
优化后的代码:
package main
import (
"math/rand"
"strings"
"github.com/pkg/profile"
)
const letterBytes = "abcdefghijklmnopqrstuvwxyzABCDEFGHIJKLMNOPQRSTUVWXYZ"
func randomString(n int) string {
b := make([]byte, n)
for i := range b {
b[i] = letterBytes[rand.Intn(len(letterBytes))]
}
return string(b)
}
func concat(n int) string {
sb := new(strings.Builder)
for i := 0; i < n; i++ {
sb.WriteString(randomString(n))
}
return sb.String()
}
func main() {
defer profile.Start(profile.MemProfile, profile.MemProfileRate(1)).Stop()
concat(100)
}
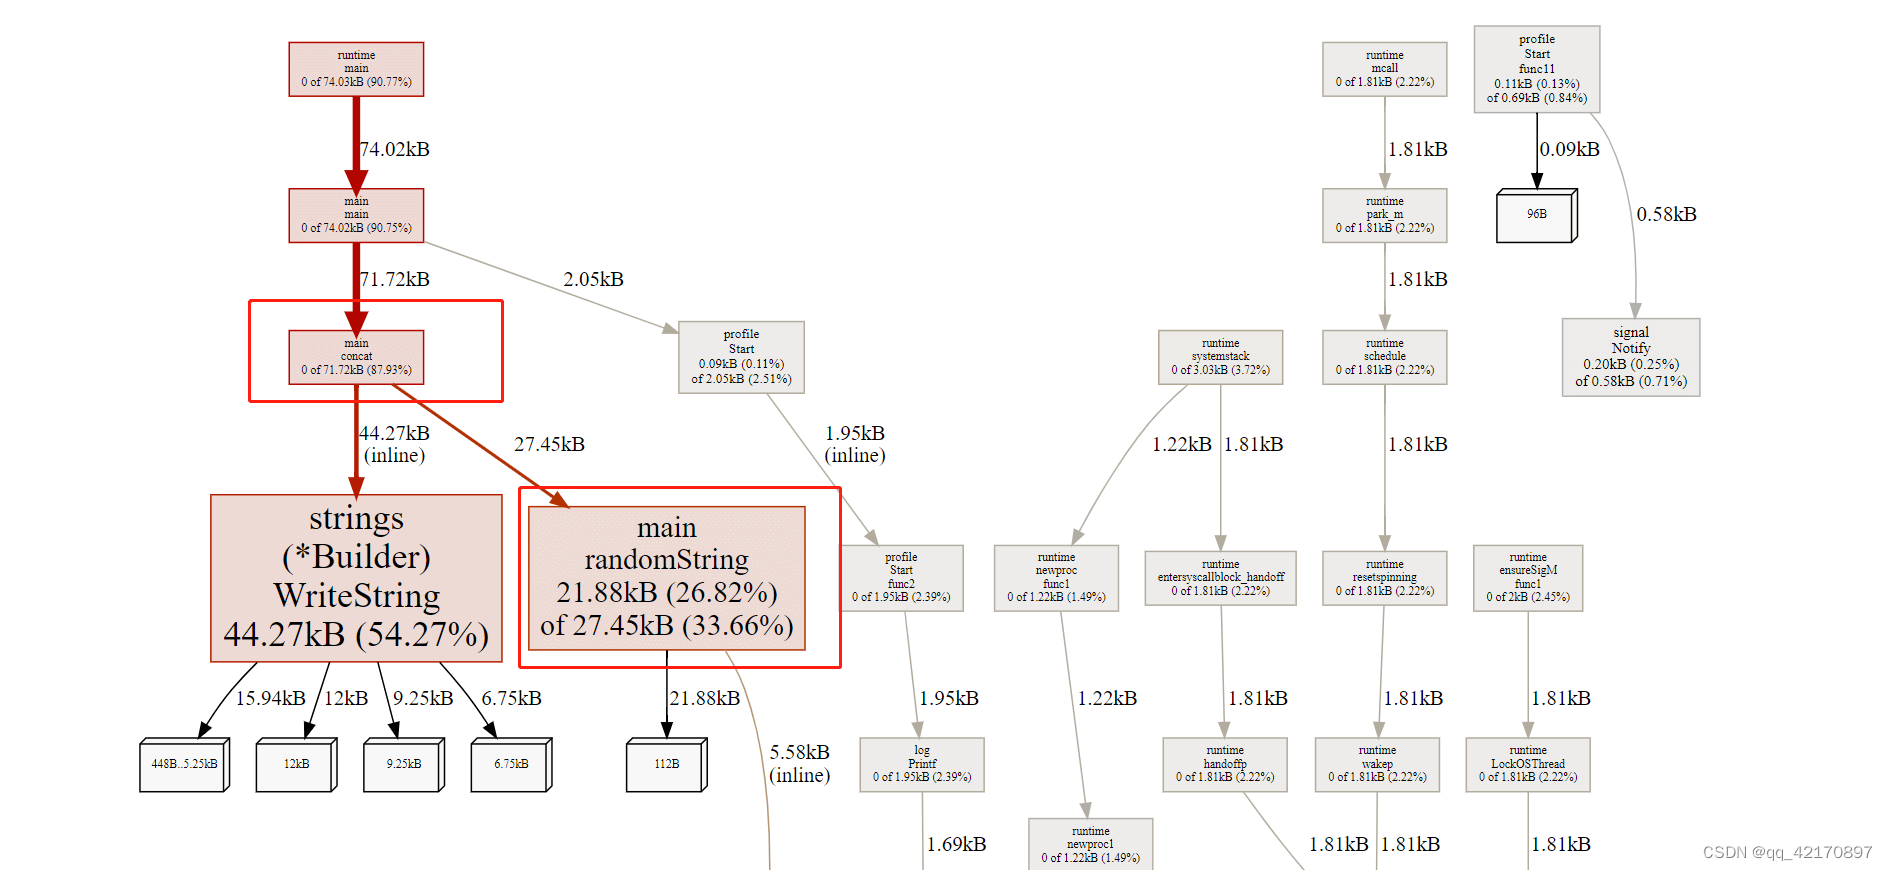
优化后可以看到concat 函数使用了71KB 内存,randomString函数使用了 21kb 内存。
四、benchmark 生成 profile使用benchmark 进行基准测试时,除了直接查看结果,还可以生成profile
testing支持cpu、mem、block
-cpuprofile=$FILE
-memprofile=$FILE, -memprofilerate=N 调整记录速率为原来的 1/N。
-blockprofile=$FILE
fib_test.go
package fib
import "testing"
func fib(n int) int {
if n == 0 || n == 1 {
return n
}
return fib(n-2) + fib(n-1)
}
func BenchmarkFib(b *testing.B) {
for n := 0; n < b.N; n++ {
fib(30) // run fib(30) b.N times
}
}
go test -bench=. test/bench/fib -cpuprofile=cpu.pprof
go tool pprof -test cpu.pprof
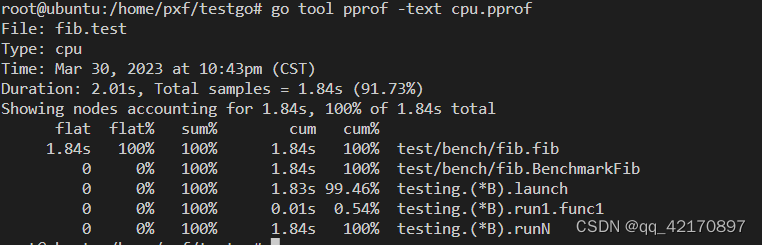
go tool pprof 支持多种输出格式:
go tool pprof

到此这篇关于Golang pprof性能测试与分析讲解的文章就介绍到这了,更多相关Go pprof性能测试内容请搜索软件开发网以前的文章或继续浏览下面的相关文章希望大家以后多多支持软件开发网!