新型冠状肺炎全球排名前15位国家感染人数及动态排序图制作,从1月底到5月初
首先爬取who官网疫情数据,由于动图制作数据太多报错,因此截取其排名前15国家。
效果如下:
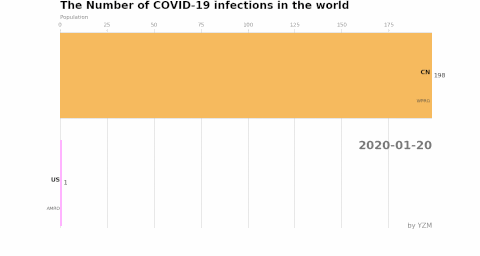
由于文件太大,csdn只支持5兆上传,因此压缩后模糊了
完整代码如下:
import pandas as pd
import matplotlib
import matplotlib.pyplot as plt
import  matplotlib.ticker as ticker
import matplotlib.animation as animation
import time, datetime
matplotlib.rcParams['animation.embed_limit'] = 2**128
df = pd.read_csv(r'./肺炎数据爬取代码/who肺炎数据.csv',
                 usecols=['Country', 'Region', 'day', 'Cumulative_Confirmed'])
colors = dict(zip(
    ['AFRO', 'AMRO', 'EMRO', 'EURO',
     'SEARO', 'WPRO'],
    ['#adb0ff', '#ffb3ff', '#90d595', '#e48381',
     '#aafbff', '#f7bb5f']
))
group_lk = df.set_index('Country')['Region'].to_dict()
fig, ax = plt.subplots(figsize=(15, 8))
def draw_barchart(day):
    dff = df[df['day'].eq(day)].sort_values(by='Cumulative_Confirmed', ascending=True).tail(15)
    ax.clear()
    ax.barh(dff['Country'], dff['Cumulative_Confirmed'], color=[colors[group_lk[x]] for x in dff['Country']])
    dx = dff['Cumulative_Confirmed'].max() / 200
    for i, (Cumulative_Confirmed, Country) in enumerate(zip(dff['Cumulative_Confirmed'], dff['Country'])):
        ax.text(Cumulative_Confirmed - dx, i, Country, size=14, weight=600, ha='right', va='bottom')
        ax.text(Cumulative_Confirmed - dx, i - .25, group_lk[Country], size=10, color='#444444', ha='right', va='baseline')
        ax.text(Cumulative_Confirmed + dx, i, f'{Cumulative_Confirmed:,.0f}', size=14, ha='left', va='center')
    # ... polished styles
    ax.text(1, 0.4, timestamp_to_format(day).split(' ')[0], transform=ax.transAxes, color='#777777', size=26, ha='right', weight=800)
    ax.text(0, 1.06, 'Population', transform=ax.transAxes, size=12, color='#777777')
    ax.xaxis.set_major_formatter(ticker.StrMethodFormatter('{x:,.0f}'))
    ax.xaxis.set_ticks_position('top')
    ax.tick_params(axis='x', colors='#777777', labelsize=12)
    ax.set_yticks([])
    ax.margins(0, 0.01)
    ax.grid(which='major', axis='x', linestyle='-')
    ax.set_axisbelow(True)
    ax.text(0, 1.11, 'The Number of COVID-19 infections in the world',
            transform=ax.transAxes, size=24, weight=600, ha='left')
    ax.text(1, 0, 'by YZM', transform=ax.transAxes, ha='right',size=15,
                color='#777777', bbox=dict(facecolor='white', alpha=0.8, edgecolor='white'))
    plt.box(False)
def timestamp_to_format(timestamp=None,format = '%Y-%m-%d %H:%M:%S'):
    if timestamp:
        time_tuple = time.localtime(timestamp)
        res = time.strftime(format,time_tuple)
    else:
        res = time.strftime(format)
    return res
animator = animation.FuncAnimation(fig=fig, func=draw_barchart, frames=range(1579478400, 1588377600,86400))
animator.save("动态排序.gif")
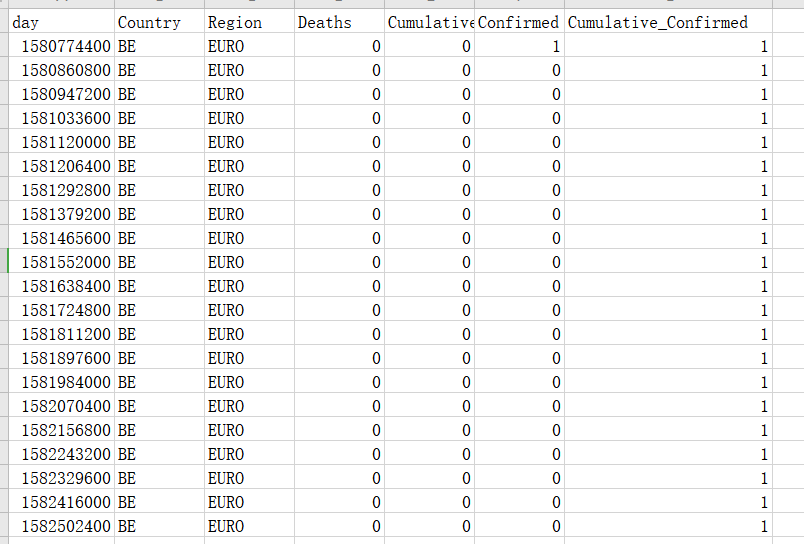
爬取的数据,其excel数据格式如下:
 原创文章 17获赞 38访问量 3万+
关注
私信
展开阅读全文
原创文章 17获赞 38访问量 3万+
关注
私信
展开阅读全文
作者:新月清光
相关文章
Jenna
2020-10-09
Xena
2020-07-03
Hope
2021-07-09
Thalia
2023-05-17
Kara
2023-05-18
Victoria
2023-05-18
Tricia
2023-05-23
Victoria
2023-07-17
Liana
2023-07-20
Hester
2023-07-20
Ianthe
2023-07-20
Rachel
2023-07-20
Bella
2023-07-20
Isis
2023-07-20
Jacinda
2023-07-20
Winola
2023-07-20
Emily
2023-07-20
Irene
2023-07-20